

2021 PV Module Reliability Scorecard
Thermal Cycling
Key Takeaways
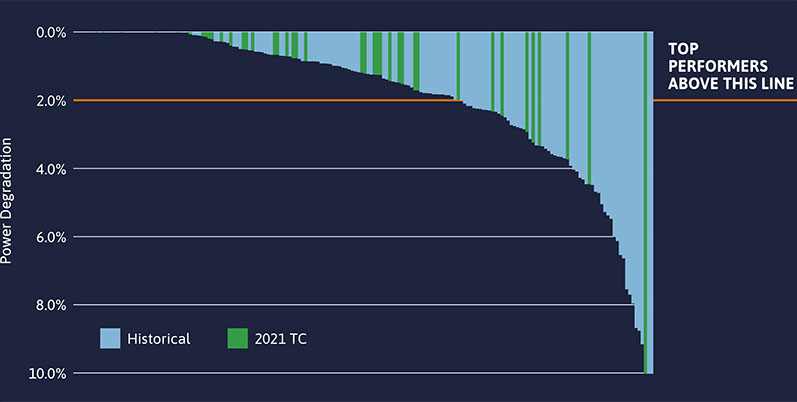
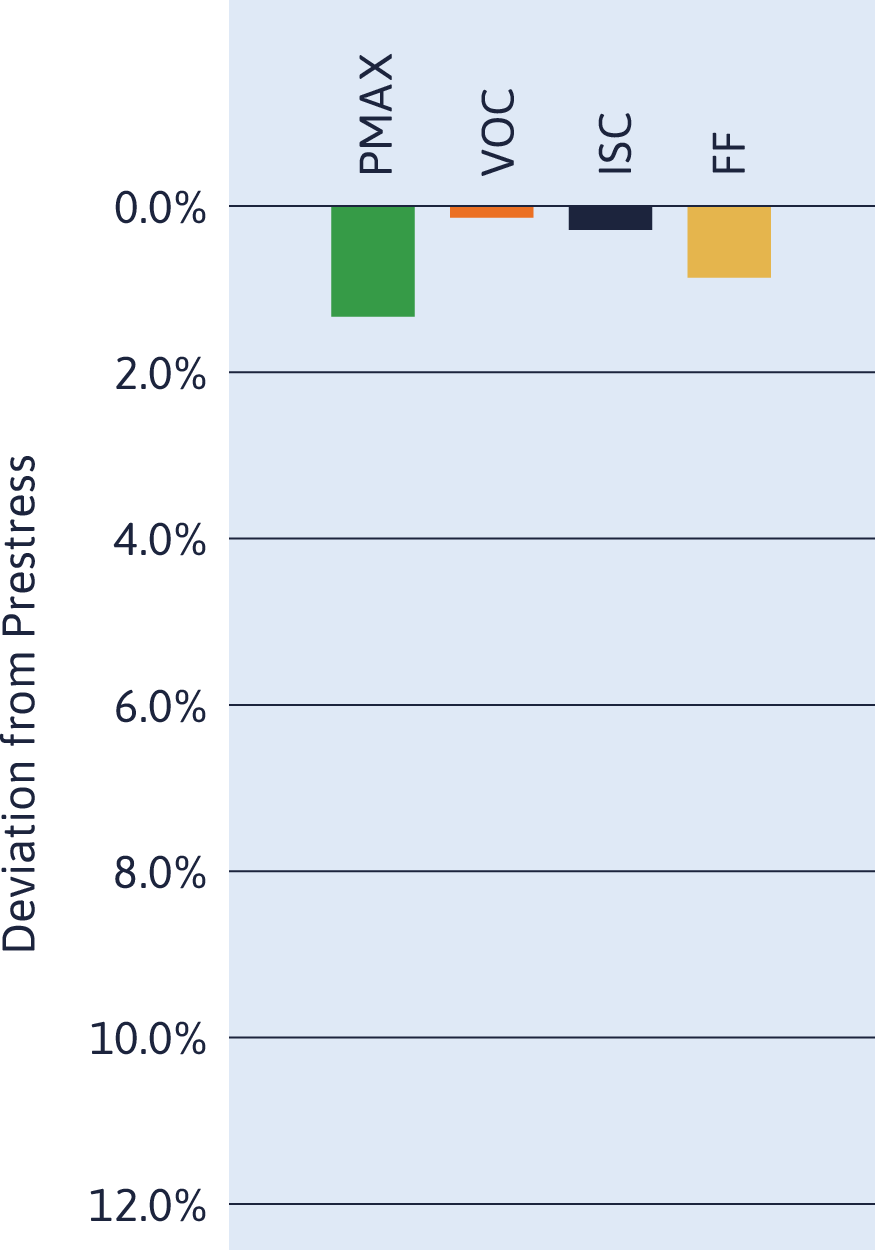
- Strong thermal cycling (TC) results continued to be a trend in the 2021 Scorecard test population with a median power degradation of -0.86% after TC600, though not all modules were Top Performers.
- Compared to PVEL’s historic PQP results, monocrystalline wafers and Passivated Emitter and Rear Contact (PERC) cells exhibit stronger TC performance than multicrystalline wafers and Aluminum Back Surface Field (Al-BSF) cells.
- For all the advantages of multi-busbar (MBB) modules, e.g., reduced power loss from microcracks and higher output power, improper soldering can lead to poor TC results. Three-, four- and five-busbar modules have thus far on average performed better in TC than MBB modules.
- Modules can meet the requirements for IEC 61215 after completing 200 thermal cycles but then exhibit significant degradation following the PQP’s more rigorous TC600 benchmark.
- Bifacial TC results showed both glass//glass and glass//backsheet bifacial modules achieving Top Performer status, with the amounts of front-side and rear-side power degradation aligned.
2021 Top Performers
Manufacturer
Model Types
Adani/Mundra
ASB-7-AAA-n (ASB-6-AAA-n) ;
ASB-7-AAA-p (ASB-6-AAA-p)
ASB-7-AAA-p (ASB-6-AAA-p)
Astronergy
CHSM72M(DG)/F-BH-xxx (CHSM60M(DG)/F-BH-xxx) ;
CHSM72M‐HC‐xxx (CHSM60M‐HC‐xxx)
CHSM72M‐HC‐xxx (CHSM60M‐HC‐xxx)
Boviet
BVM6612M-xxxL-H-BF-DG (BVM6610M-xxxL-H-BF-DG) ;
BVM6612M-xxxL-H-HC-BF-DG (BVM6610M-xxxL-H-HC-BF-DG)
BVM6612M-xxxL-H-HC-BF-DG (BVM6610M-xxxL-H-HC-BF-DG)
ET Solar
ET-M672BHxxxTW (ET-M660BHxxxTW)
GCL
GCL-M3/72DH (GCL-M3/60DH) ;
GCL-M3/72GDF (GCL-M3/60GDF) ;
GCL-M3/72H (GCL-M3/60H) ;
GCL-M6/72GDF (GCL-M6/60GDF)
GCL-M3/72GDF (GCL-M3/60GDF) ;
GCL-M3/72H (GCL-M3/60H) ;
GCL-M6/72GDF (GCL-M6/60GDF)
Hyundai
HiS-SxxxGI
Jinko
JKMxxxM-72H-TV (JKMxxxM-72HL-TV, JKMxxxM-60H-TV, JKMxxxM-60HL-TV)
LONGi
LR4-72HBD-xxxM (LR4-60HBD-xxxM) ;
LR4-72HIBD-xxxM (LR4-60HIBD-xxxM) ;
LR4-72HIH-xxxM (LR4-60HIB-xxxM) ;
LR4-72HPH-xxxM (LR4-60HPH-xxxM, LR4-60HPB-xxxM) ;
LR6-72HPH-xxxM (LR6-60HPH-xxxM, LR6-60HPB-xxxM)
LR4-72HIBD-xxxM (LR4-60HIBD-xxxM) ;
LR4-72HIH-xxxM (LR4-60HIB-xxxM) ;
LR4-72HPH-xxxM (LR4-60HPH-xxxM, LR4-60HPB-xxxM) ;
LR6-72HPH-xxxM (LR6-60HPH-xxxM, LR6-60HPB-xxxM)
Maxeon/SunPower
SPR-Axxx-G-AC (SPR-MAX5-xxx-E3-AC, SPR-Axxx-BLK-G-AC, SPR-MAX5-xxx-BLK-E3-AC, SPR-Axxx, SPR-MAX5-xxx, SPR-Axxx-BLK, SPR-MAX5-xxx-BLK) ;
SPR-P3-xxx-COM-1500 (SPR-P3-xxx-BLK)
SPR-P3-xxx-COM-1500 (SPR-P3-xxx-BLK)
Phono Solar
PSxxxM4GFH-24/TH
Q CELLS
Q.PEAK DUO L-G5.2 (Q.PEAK DUO G5, Q.PEAK DUO BLK-G5);
Q.PEAK DUO BLK-G6+/SC (Q.PEAK DUO BLK-G6+, Q.PEAK DUO-G6+) ;
Q.PEAK DUO-G7 (Q.PEAK DUO BLK-G7);
Q.PEAK DUO L-G8.3 (Q.PEAK DUO BLK-G8+, Q.PEAK DUO-G8+) ;
Q.PEAK DUO L-G8.3/BFG
Q.PEAK DUO BLK-G6+/SC (Q.PEAK DUO BLK-G6+, Q.PEAK DUO-G6+) ;
Q.PEAK DUO-G7 (Q.PEAK DUO BLK-G7);
Q.PEAK DUO L-G8.3 (Q.PEAK DUO BLK-G8+, Q.PEAK DUO-G8+) ;
Q.PEAK DUO L-G8.3/BFG
REC Group
TP3M Black
Seraphim
SRP-xxx-BMA-BG
Silfab
SIL-xxxBL
Note: Manufacturers are listed in alphabetical order. The tested product is listed first. Variants for which the test results are representative are listed in parentheses. In some cases, test results were not available at the time of publication.
Power Degradation for Each Model Type
About the Test
Background of the Test
As fielded temperatures rise and fall, PV module components expand and contract. With different thermal expansion coefficients, components can expand and contract at different rates in the same environmental conditions. This stresses the bonds between each PV module layer. Solder bond fatigue, for example, increases voltage drop in the module as current passes through a higher-resistance internal circuit, thus diminishing performance when the sun is at its brightest.
Test Procedure
The thermal cycling test sequence subjects modules to extreme temperature swings in an environmental chamber where modules are chilled to -40°C, dwelled, then heated to 85°C, and dwelled again. While the temperature is increased, the modules are also subjected to maximum power current. The cycle repeats 200 times over three periods for a total of 600 cycles. IEC 61215 testing, by comparison, requires 200 cycles overall.
Lessons Learned from Failure
The Problem
Expansion and contraction of cell layers increases series resistance along the edges of the cells.
Projects Facing the Greatest Risk
While expansion and contraction occurs in moderate climates, it can be extreme in the arid regions of the world, such as Western Australia and Chile’s Atacama Desert.
How to Detect Failure
In EL images, look for dark areas along the top or bottom of the cell, indicating that the ribbons may be lifting upward.
An Example from the Field
System size: 900 kW
Type: Rooftop
Location: Italy
Failure mode: Broken cell interconnects
Less than ten years after installation, a commercial rooftop in Italy began underperforming. Different BOMs were used throughout the project, and the busbars of one BOM were prone to breakage with more than 30% of them exhibiting this failure mode.
The defect would have been identified in PVEL’s PQP prior to procurement.
MRP Energy Solutions concluded that a lack of interconnect strain relief and/or improper interconnect specifications is the most probable root cause. This issue is likely to persist as PV module technology advances. The gaps between cells in some new module designs are decreasing along with the space historically required for strain relief.
Contributed by Mark Rossetto
Contributed by Mark Rossetto, M.Eng, CTO of MRP Renewable Energy Solutions, photos courtesy of MRP Renewable Energy Solutions.
![]()
Source Details
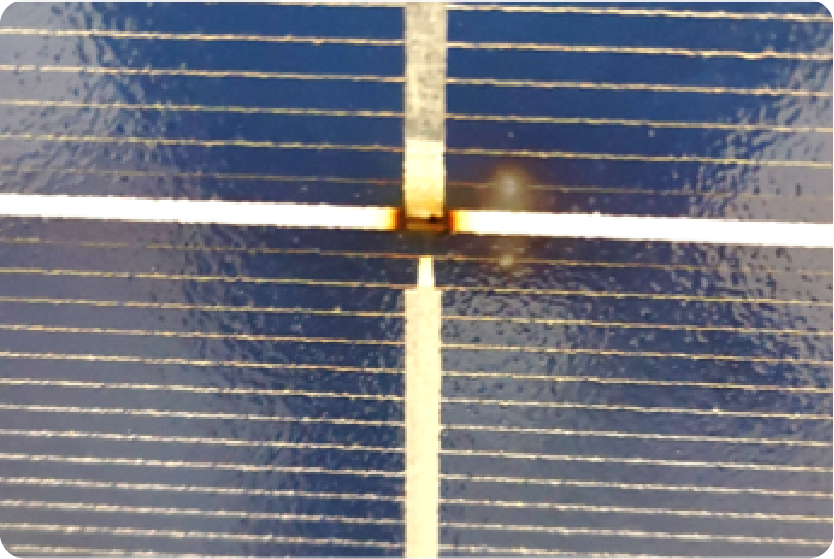
Broken ribbons in PV modules reduced energy yield.
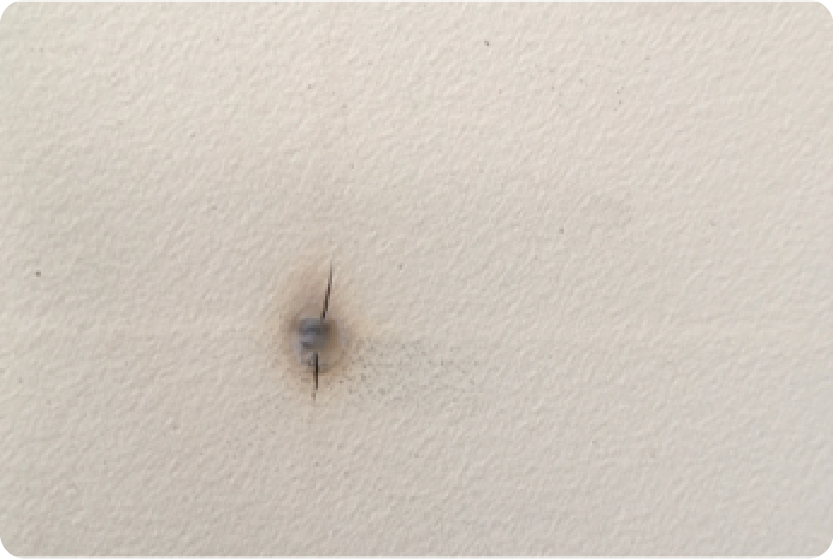
As a result, hotspots were created that compromised backsheets, which may pose safety risks over time.
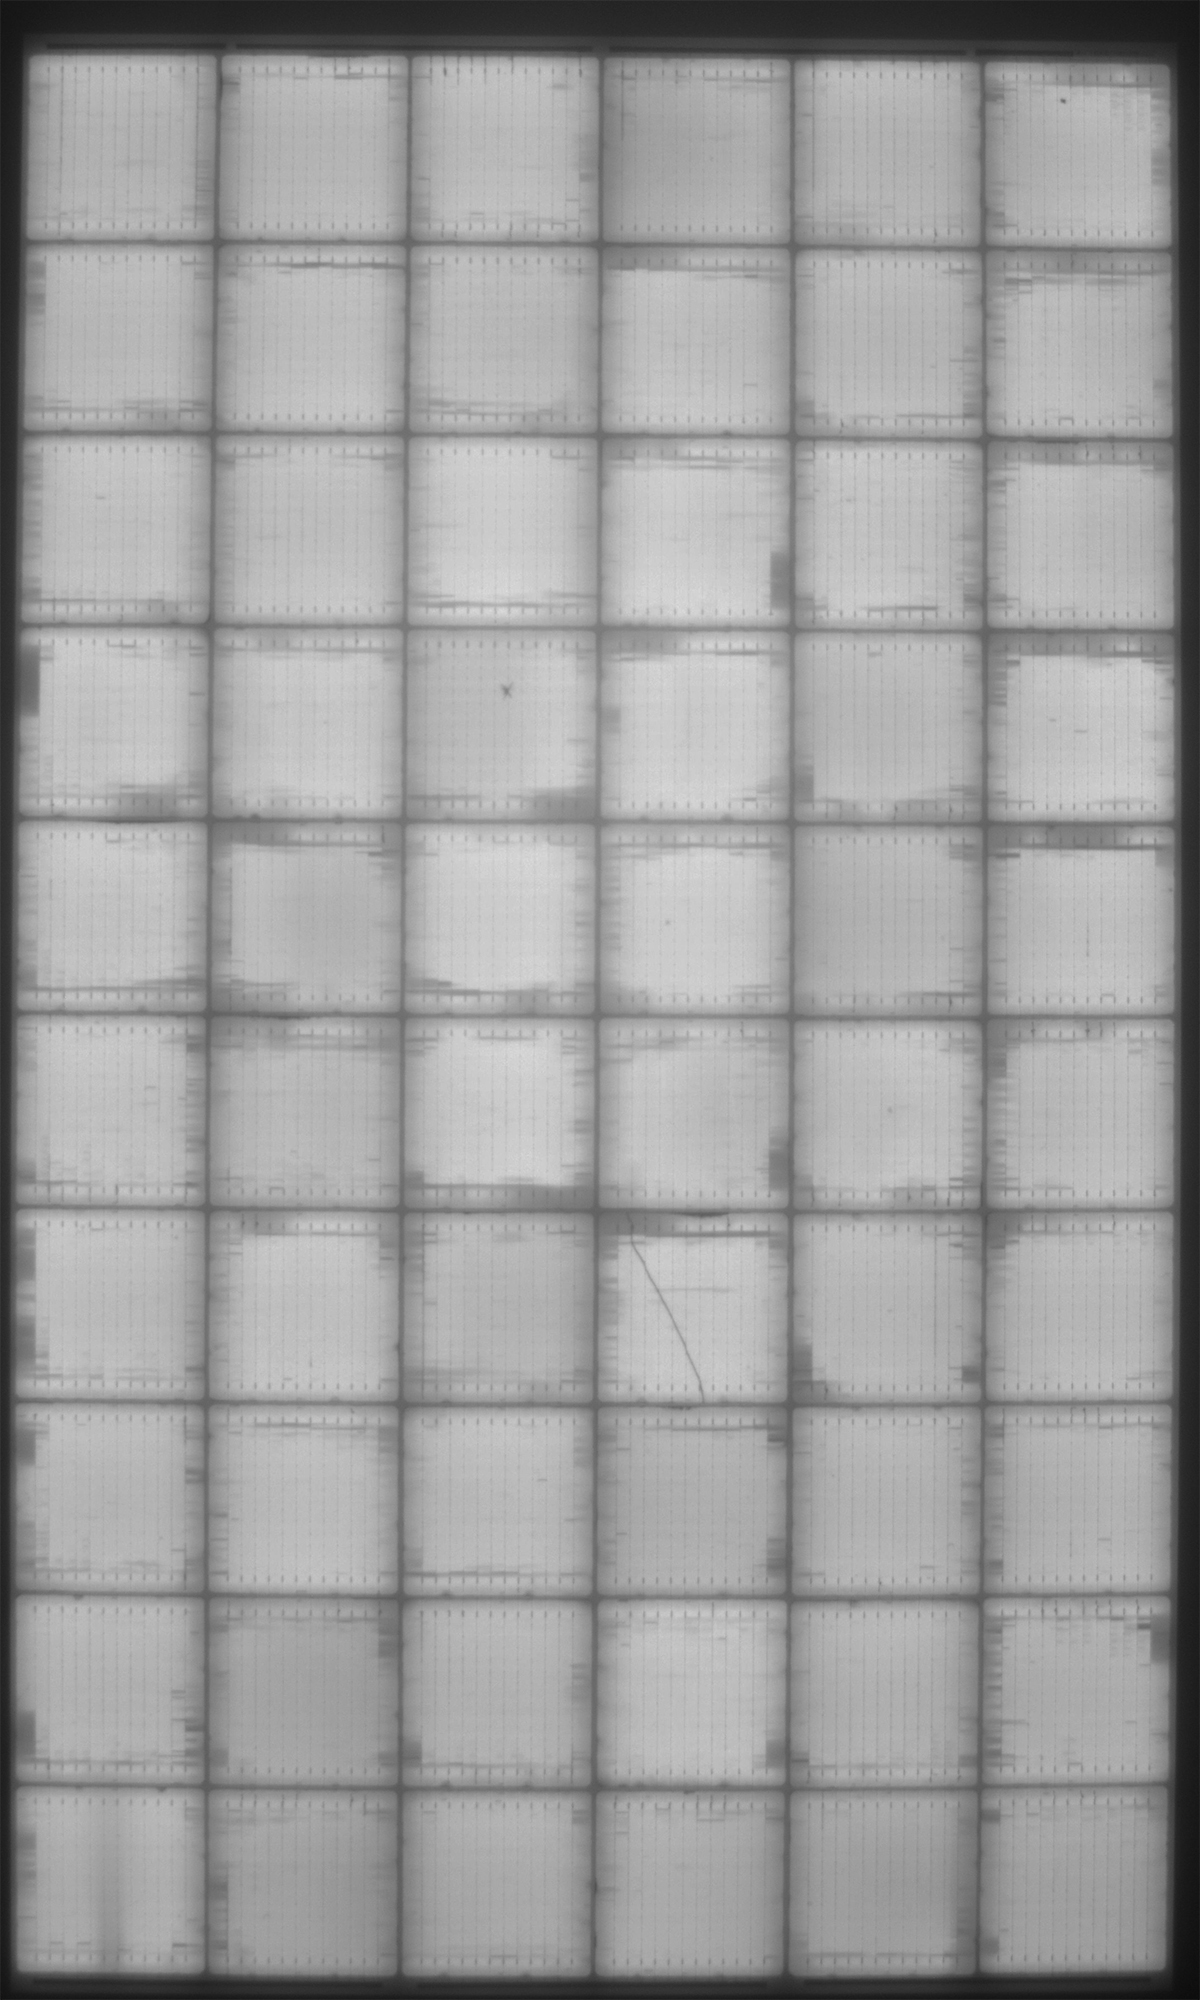
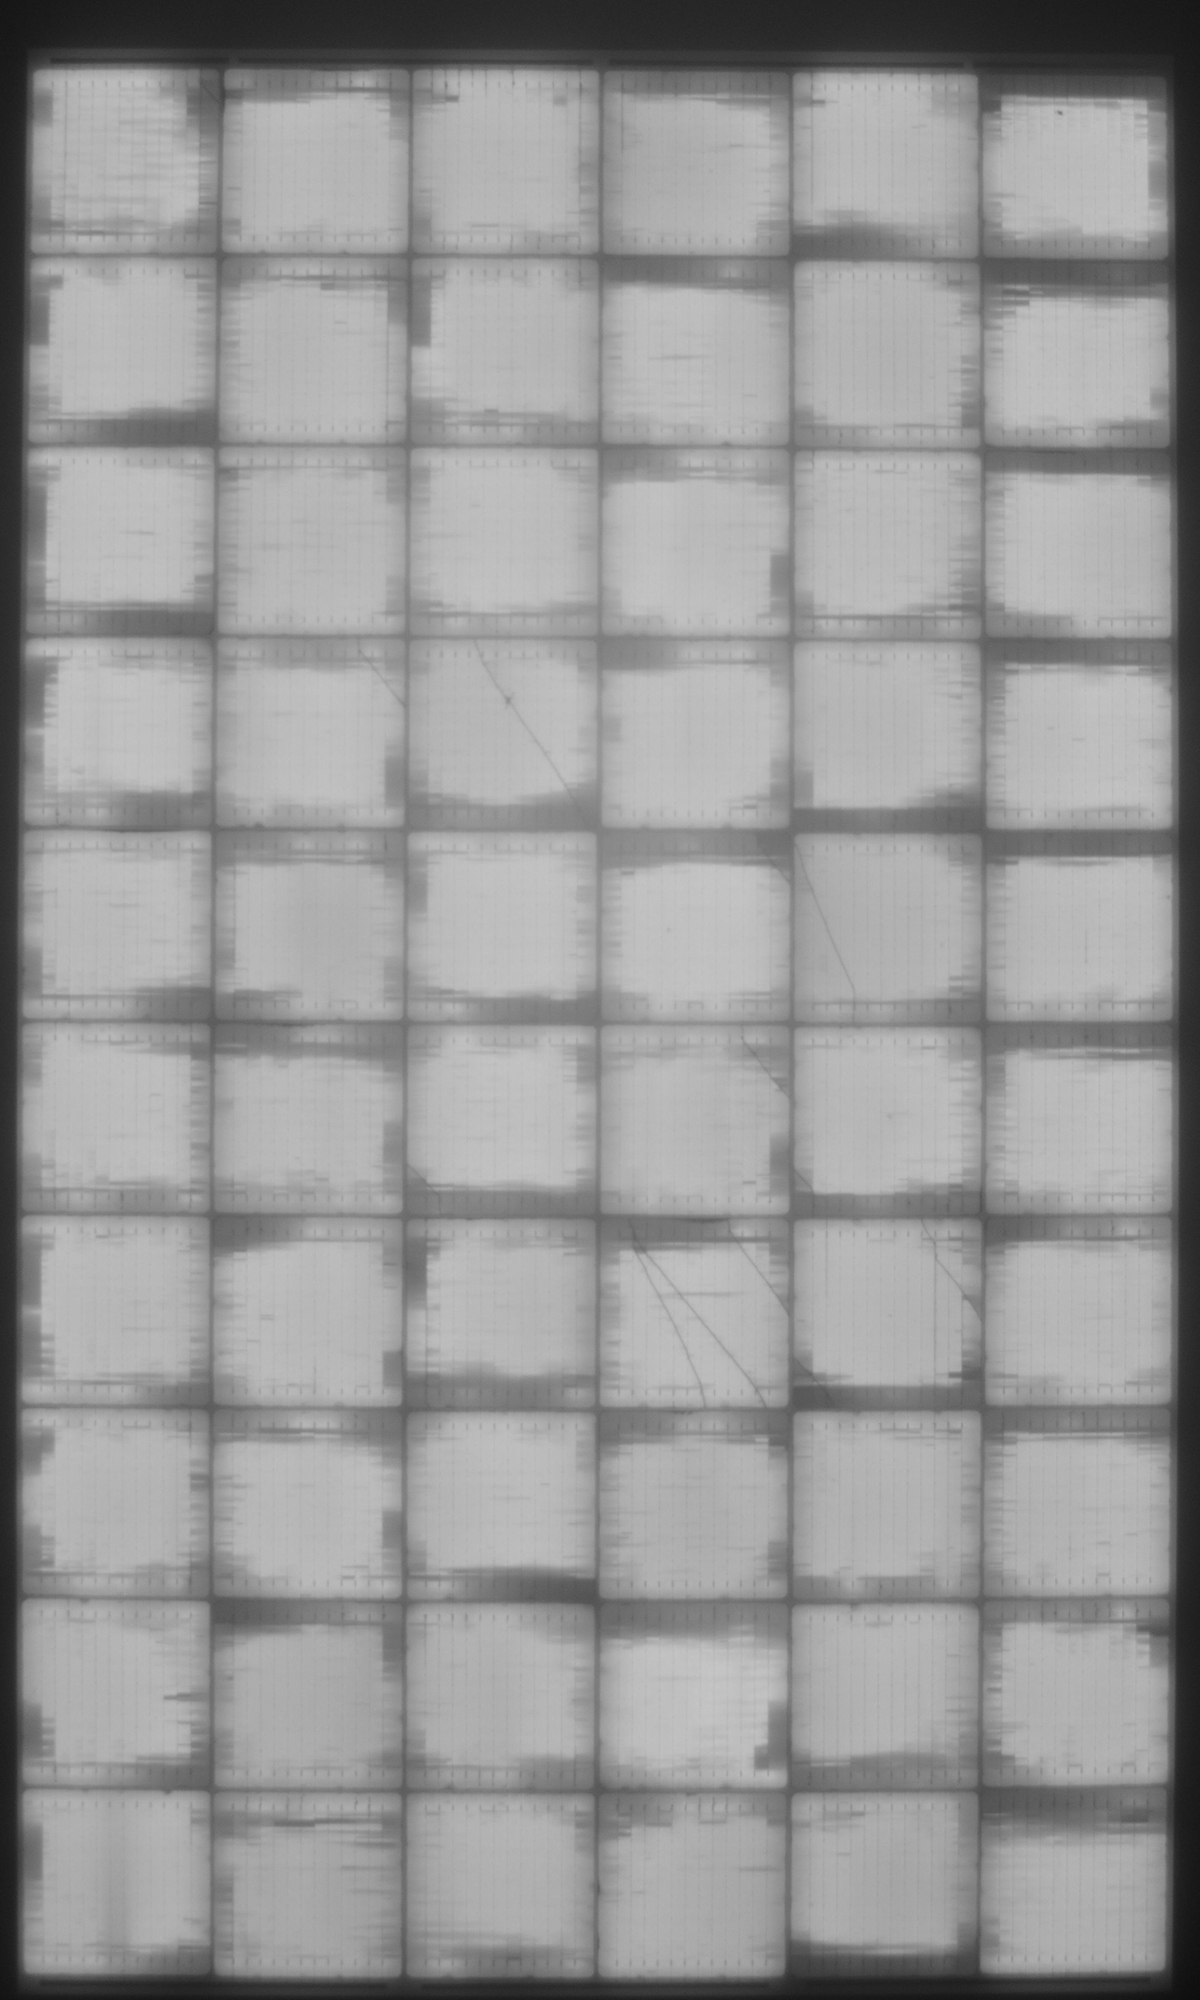
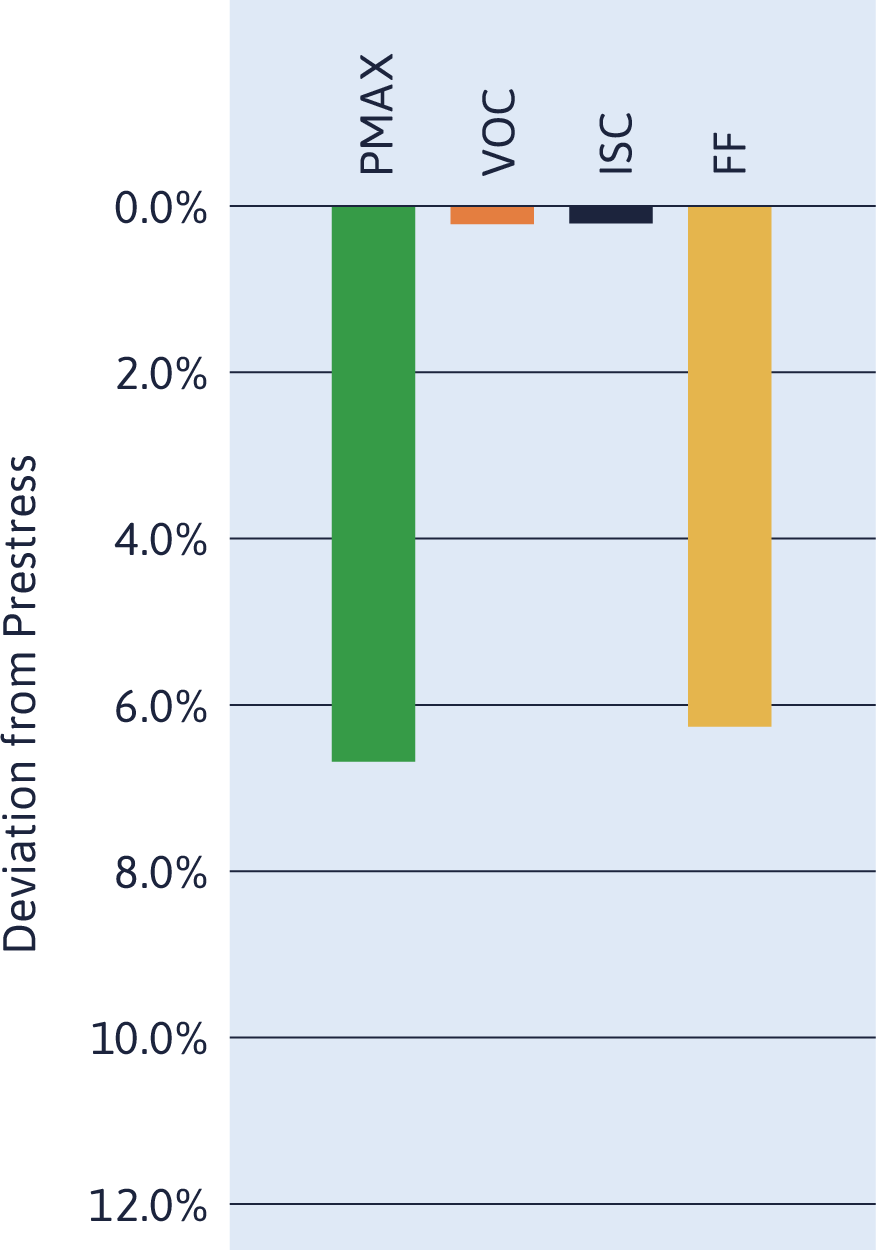
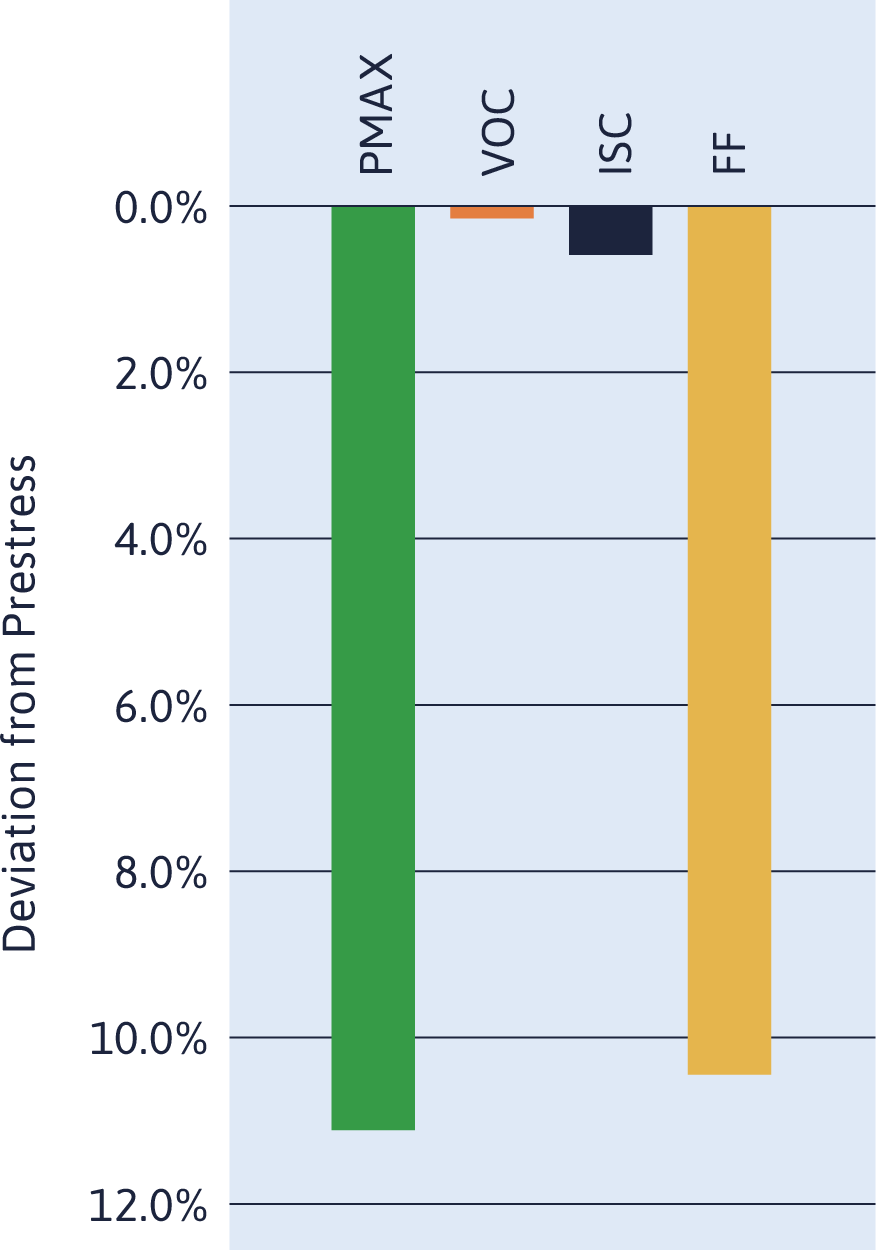
An Example from the Lab
Most modules show less than 3% degradation from thermal cycling. Through 200 cycles, the multi-busbar module displayed here registered 1.33% degradation, which easily passes IEC 61215 requirements. But after 600 cycles, degradation increased to 11.09%.
In the lab, poor setup on a single stringer or poor adhesion of ribbons to cells can cause a reduction in maximum power. The issue could be confined to one work shift or one operator. On the other hand, it could be a systemic module design issue.
The challenge for some manufacturers is that their modules have less surface area for each soldered connection and more busbars overall, requiring greater precision and better process controls.
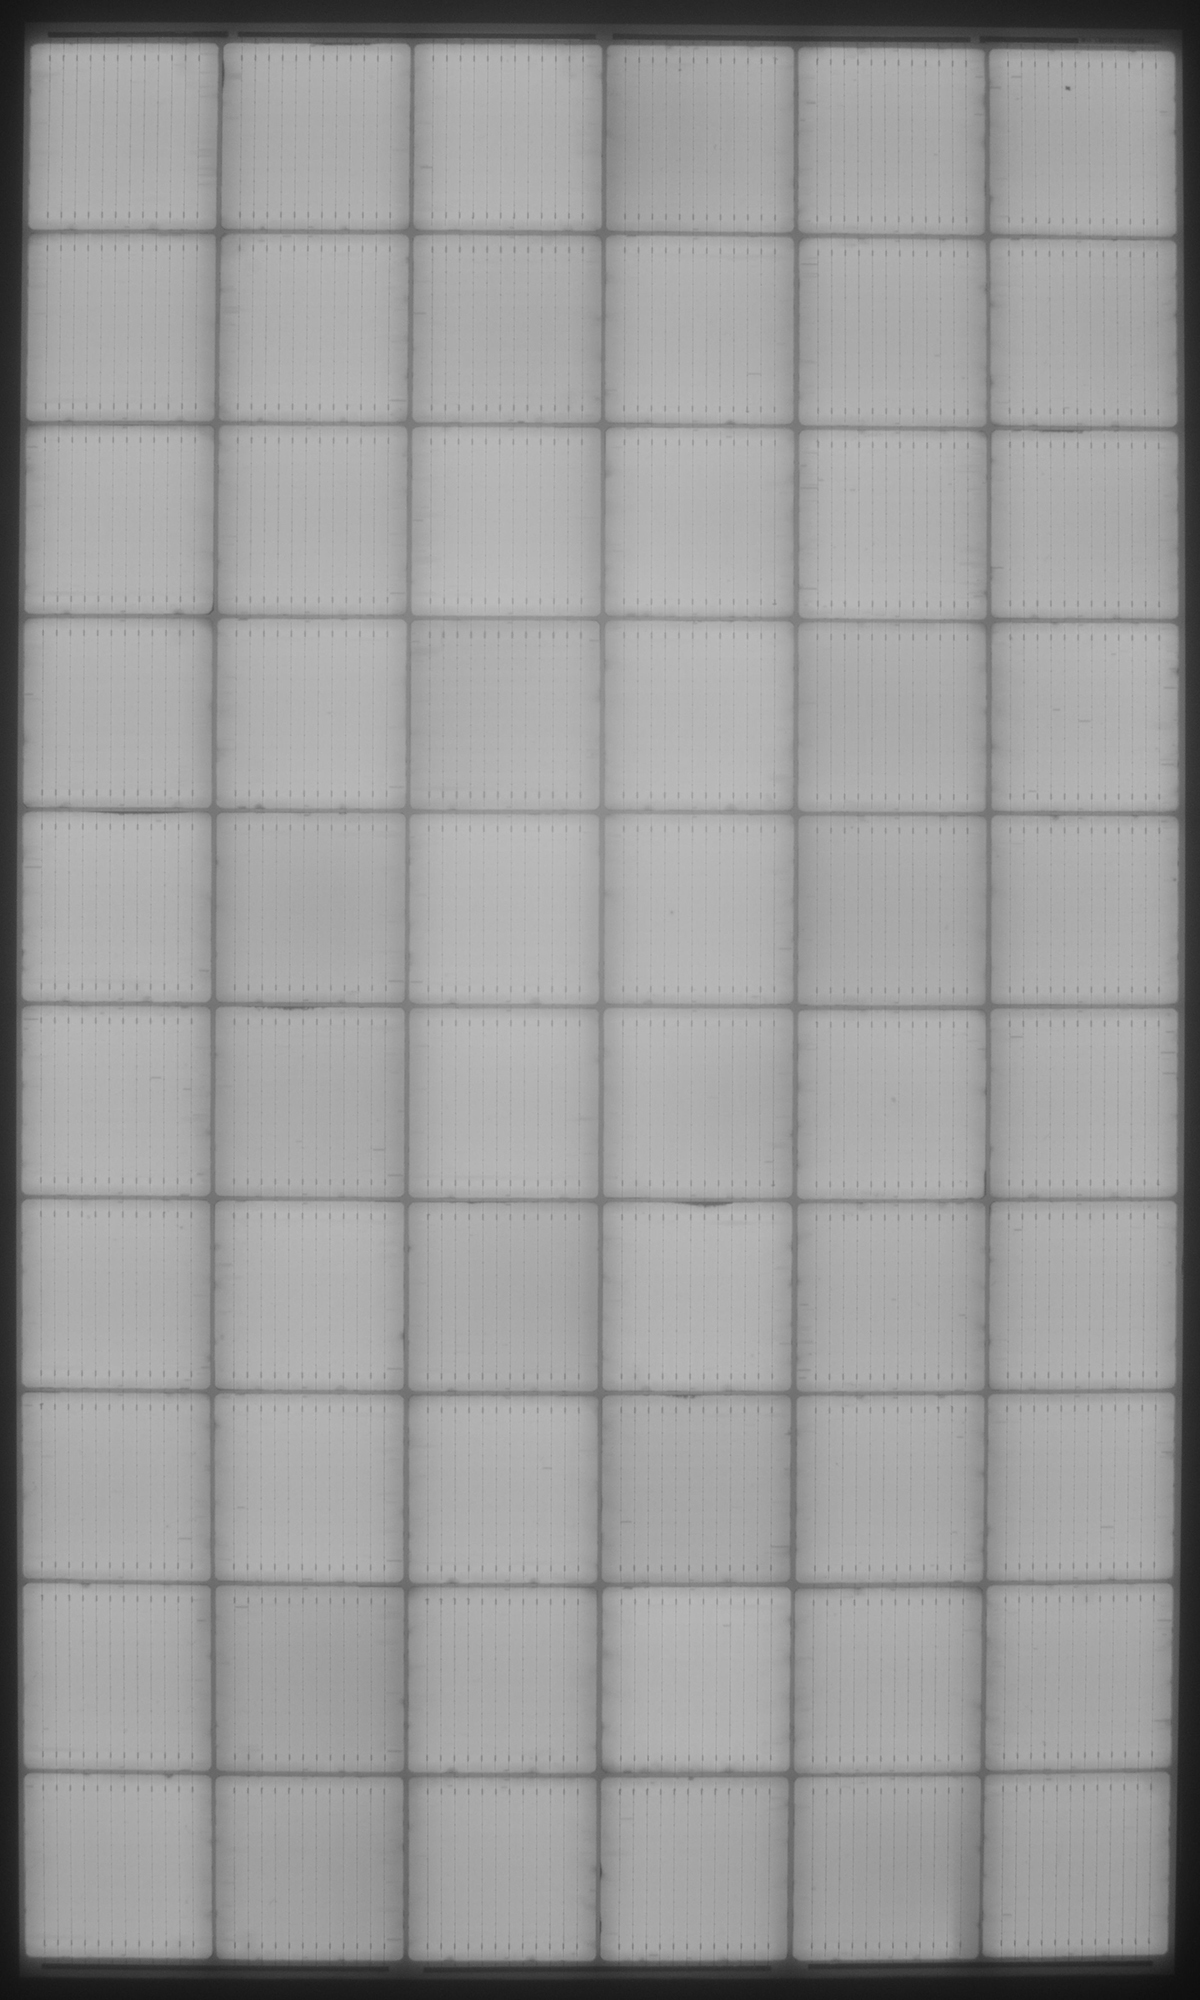
Prestress
TC200
TC400

TC600
Power Degradation After:
200 cycles: 1.3%
400 cycles: 6.7%
600 cycles: 11.1%
Learn something new?
Share it with your network.