

2021 PV Module Reliability Scorecard
LID + LETID
Key Takeaways
- The impact of light-induced degradation (LID) on Al-BSF cells is well-understood, but the industry lacks clarity for PERC technology, which is also affected by light and elevated temperature induced degradation (LETID).
- Test results for both boron- and gallium-doped PERC modules show that LID and LETID can be solved, but it is possible that new degradation modes will emerge in the field over time.
- Procuring modules with low LID and LETID rates increases the value of a project; the results from LID and LETID testing are direct inputs for energy forecasts and financial models.
- Independent engineers (IEs) model LID and LETID behaviors inconsistently. Some IEs combine LID and LETID, some model LETID recovery over time, and a range of different values are used for default assumptions.
2021 Top Performers
Manufacturer
Model Types
Adani/Mundra
ASB-7-AAA-n (ASB-6-AAA-n)
Astronergy
CHSM72M(DG)/F-BH-xxx (CHSM60M(DG)/F-BH-xxx) ;
CHSM72M‐HC‐xxx (CHSM60M‐HC‐xxx)
CHSM72M‐HC‐xxx (CHSM60M‐HC‐xxx)
Boviet
BVM6612M-xxxL-H (BVM6610M-xxxL-H) ;
BVM6612M-xxxS-H-HC-BF-DG (BVM6610M-xxxS-H-HC-BF-DG)
BVM6612M-xxxS-H-HC-BF-DG (BVM6610M-xxxS-H-HC-BF-DG)
ET Solar
ET-M660BHxxxBB (ET-M672BHxxxBB) ;
ET-M672BHxxxTW (ET-M660BHxxxTW)
ET-M672BHxxxTW (ET-M660BHxxxTW)
HHDC
SPICN6(MDF)-72-xxx/BIH (SPICN6(MDF)-60-xxx/BIH)
HT-SAAE
HT72-156M(V) (HT72-156M, HT60-156M)
Hyundai
HiS-SxxxGI
JA Solar
JAM72S10-xxx/MR (JAM78S10-xxx/MR, JAM60S10-xxx/MR, JAM60S17-xxx/MR)
Jinko
JKMxxxM-72H-TV (JKMxxxM-72HL-TV, JKMxxxM-60H-TV, JKMxxxM-60HL-TV);
JKMxxxM-7RL3-V (JKMxxxM-6RL3, JKMxxxM-6RL3-B)
JKMxxxM-7RL3-V (JKMxxxM-6RL3, JKMxxxM-6RL3-B)
Jolywood
JW-HD144N-xxx (JW-HD120N-xxx)
LG Electronics
LGxxxN2W-V5 (LGxxxN1C-V5) ;
LGxxxN1C-N5 ;LGxxxQ1C-A6
LGxxxN1C-N5 ;LGxxxQ1C-A6
LONGi
LR4-72HIH-xxxM (LR4-60HIB-xxxM) ;
LR4-72HPH-xxxM (LR4-60HPH-xxxM, LR4-60HPB-xxxM) ;
LR4-72HPH-xxxM (LR4-60HPH-xxxM, LR4-60HPB-xxxM) ;
Maxeon/SunPower
SPR-Axxx-G-AC (SPR-MAX5-xxx-E3-AC, SPR-Axxx-BLK-G-AC, SPR-MAX5-xxx-BLK-E3-AC, SPR-Axxx, SPR-MAX5-xxx, SPR-Axxx-BLK, SPR-MAX5-xxx-BLK, SPR-Axxx-COM, SPR-MAX5-xxx-COM)
Phono Solar
PSxxxM4GFH-24/TH
Q CELLS
Q.PEAK DUO L‐G5.2 (Q.PEAK DUO-G5, Q.PEAK DUO BLK-G5) ;
Q. PEAK DUO BLK‐G6+ (Q.PEAK DUO‐G6+, Q.PEAK DUO BLK-G6+/AC, Q.PEAK DUO L-G6.2, Q.PEAK DUO BLK-G6+/SC) ;
Q.PEAK DUO L-G8.3/BFG ;Q.PEAK DUO BLK ML-G9+ (Q.PEAK DUO XL-G9.2)
Q. PEAK DUO BLK‐G6+ (Q.PEAK DUO‐G6+, Q.PEAK DUO BLK-G6+/AC, Q.PEAK DUO L-G6.2, Q.PEAK DUO BLK-G6+/SC) ;
Q.PEAK DUO L-G8.3/BFG ;Q.PEAK DUO BLK ML-G9+ (Q.PEAK DUO XL-G9.2)
REC Group
Alpha (Alpha Black) ;TP3M Black
Risen Energy
RSM144‐7‐xxxBMDG (RSM120‐7‐xxxBMDG)
Talesun
TD6G72M-xxx (TD6G60M-xxx)
Trina Solar
TSM-xxxDE15M(II) (TSM-xxxDD06M(II))
Note: Manufacturers are listed in alphabetical order. The tested product is listed first. Variants for which the test results are representative are listed in parentheses. In some cases, test results were not available at the time of publication.
Power Degradation for Each Model Type

About the Test
Background of the Test
LID generally refers to the rapid power loss caused by unstable boron-oxygen compounds that occurs when p-type crystalline modules are first exposed to sunlight. Al-BSF module manufacturers historically guaranteed 3% year-one degradation for monocrystalline modules and 2.5% for multicrystalline modules. The outlook for modern PERC and PERT cells is much less clear. They are treated before module manufacturing, leading to historically low LID, but these treatments can increase LETID susceptibility.
LETID affects advanced multicrystalline and monocrystalline cell architectures. It has been shown to materialize when cells reach temperatures over 40°C while operating, which not only occurs in hot environments but also in temperate regions during high irradiance. Degradation eventually stabilizes and can recover over time, but regeneration rates vary.
Test Procedure
PVEL tests a statistically significant 17 samples for LID in the PQP. Modules are placed outdoors and connected to an inverter to operate at maximum power point. They are exposed to repeated rounds of light soaking and flash testing until stability is reached per IEC 61215:2016.
To measure LETID, two of the post-LID modules are placed in an environmental chamber at 75°C while connected to a power supply and injected with a low current for 486 hours with characterizations every 162 hours. This simulates module operation in full sun at maximum power point. The test conditions are designed to slowly approach maximum degradation, so as not to trigger additional degradation mechanisms.
LID+LETID in Practice
In PVsyst, the industry’s de facto modelling software, the proposed default value for LID is 2%. LETID and subsequent potential recovery are not yet modelled in PVsyst.
PVEL surveyed six global independent engineering firms to better understand how LID and LETID are assessed in financial models. Most IEs model LID plus LETID, so PVEL combined these rates to produce rankings for this new Top Performer category.
This methodology reflects the ideal for PV module buyers to procure BOMs that are minimally susceptible to both degradation modes. Note: separate results are provided for LID and LETID in PQP reports.
Expand each to explore the perspectives of different IEs
IE #1: LID Default: ≤1.5%
1.5% default assumption for LID on boron-doped, less for gallium-doped. No default LETID assumption; modelling depends on project location.
IE #2: LID Default: 1% to ≥2%, LETID Default: 1% to 8%
1% for LID + 1% for LETID for “high-quality” manufacturers (2% default in total). If no data is available, assume 2+% for LID and 6~8% for LETID followed by partial recovery.
IE #3: LID Default: 1.5%, LETID Default: 1.5%
1.5% for combined LID and LETID. Expect both to occur. Not modelling LETID recovery.
IE #4: LID Default: ≤1.5% to 2.5%, LETID Default: ≤1.5% to 2.5%
Specific to mono PERC: 2.5% default LID and LETID for boron-doped, will reduce to 1.5% with manufacturer guidance and <1.5% with additional statistically significant data.
1.0% default for gallium-doped. Not modelling LETID recovery.
IE #5: LID Default: 0 – 2%
LID rates depend on module technology. No comment on LETID.
IE #6: LID Default: 1.5% or 2%
1.5% and 2% default LID assumptions for multi- and mono-crystalline, respectively. Only models LETID for susceptible modules installed in hot climates. Would like to model 50% LETID recovery but unsure of recovery timeline.
An Example from the Lab
Top Performers achieved less than 2% degradation for LID and LETID combined. When these degradation modes are modeled at higher rates, project sponsors must account for the anticipated power loss through a lower project valuation, sometimes significantly. If a project has 5% profit margin, an additional 1% of LID+LETID losses represents 20% of the project’s profits.
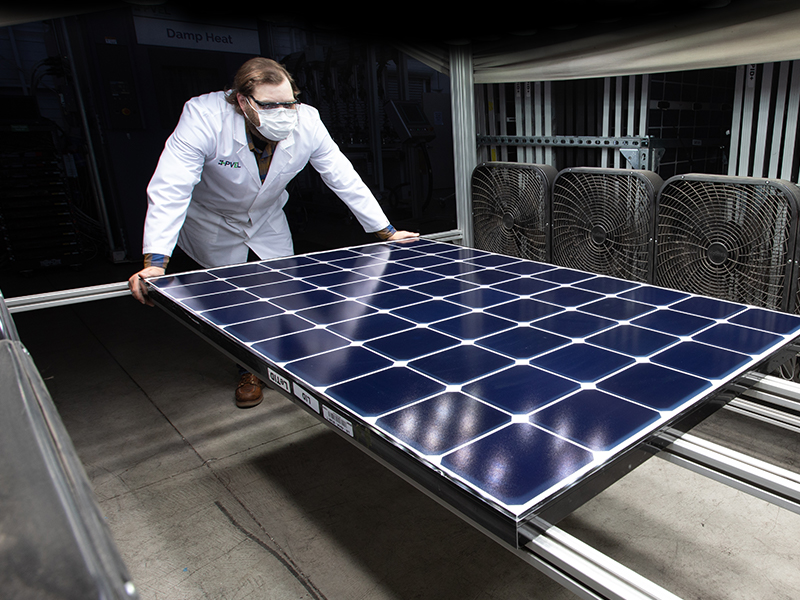
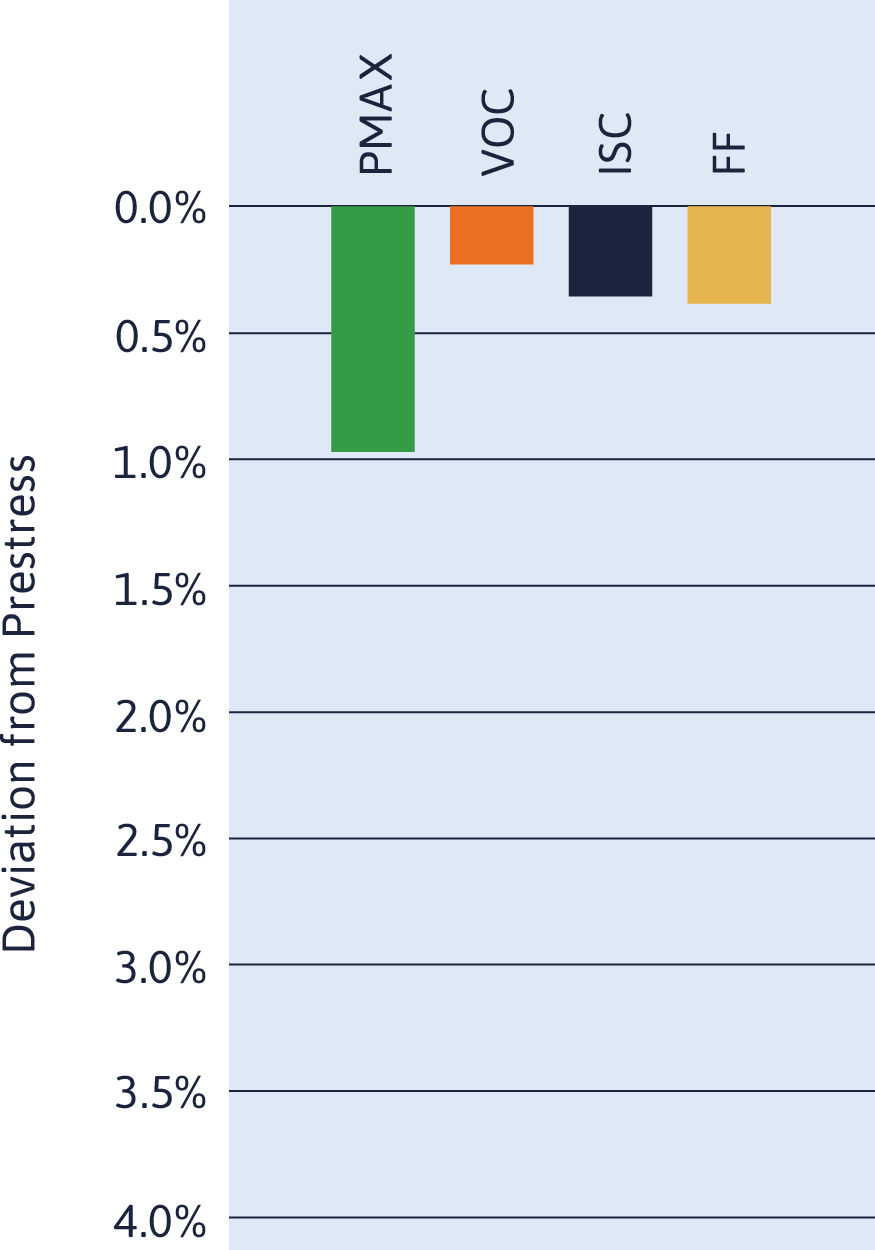
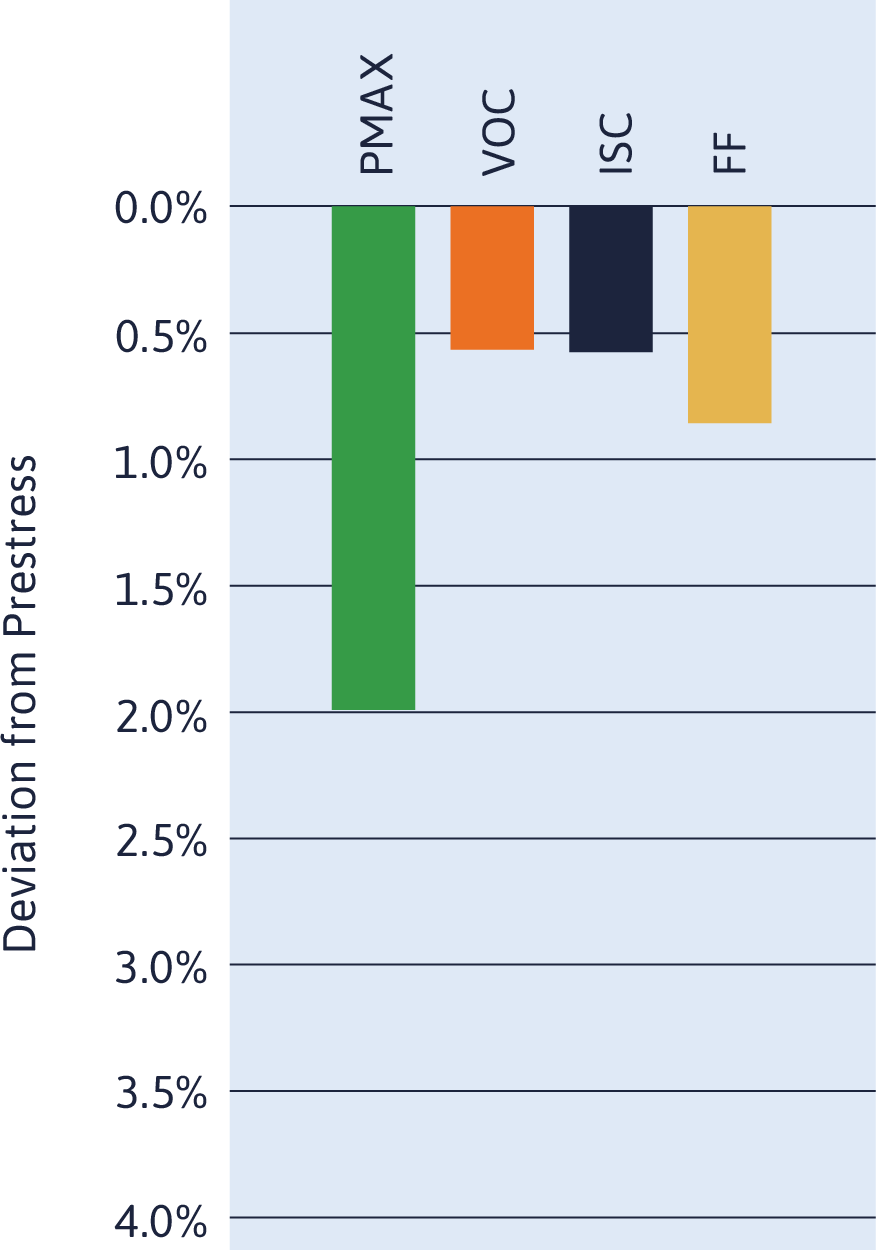
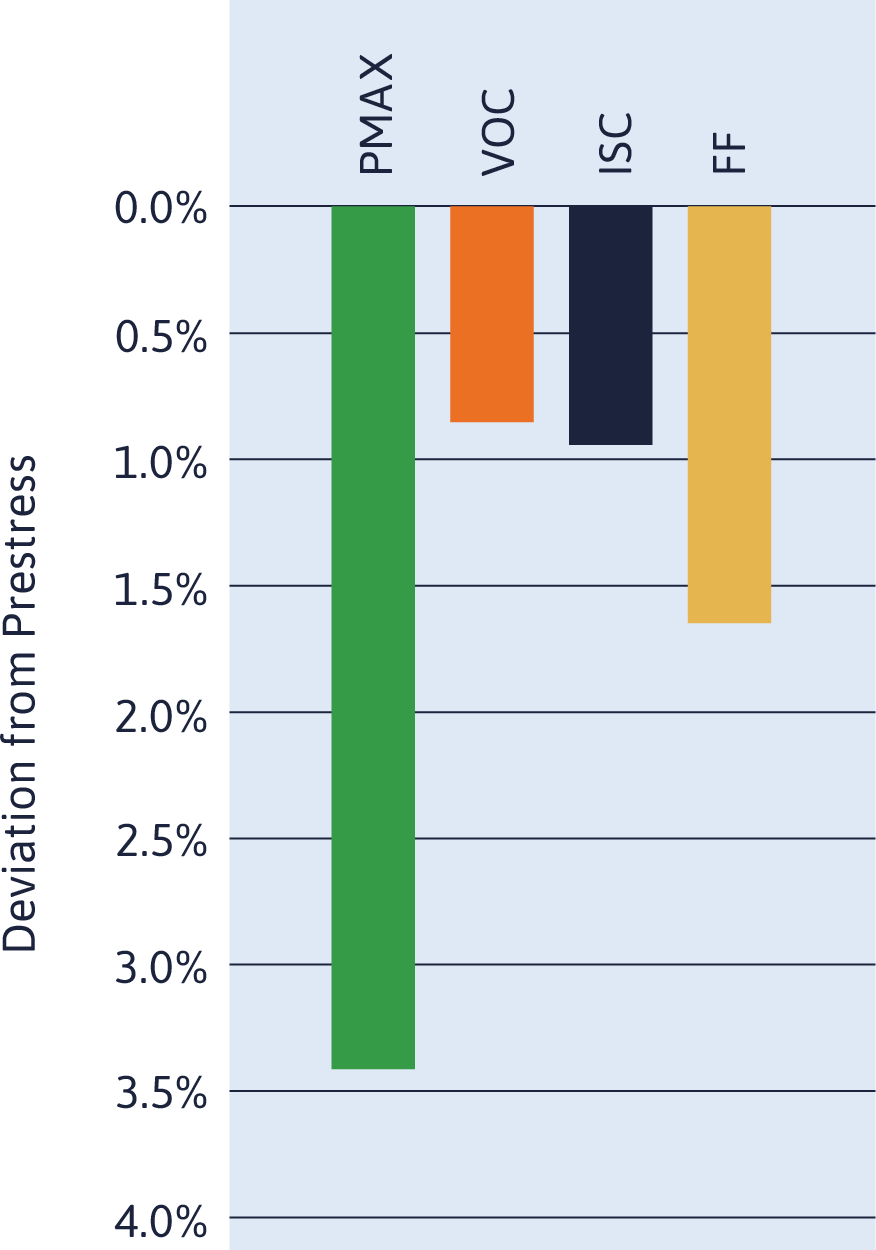
In the EL images shown here, cell checkerboarding becomes more apparent from the initial pre-light soak images though the phases of LID and LETID testing. This is a signature of LETID that is even more apparent in the 1/10th Isc EL images that are included in PQP reports. The checkerboarding in this example is coupled with increasing power loss, up to 3.4% following LETID.
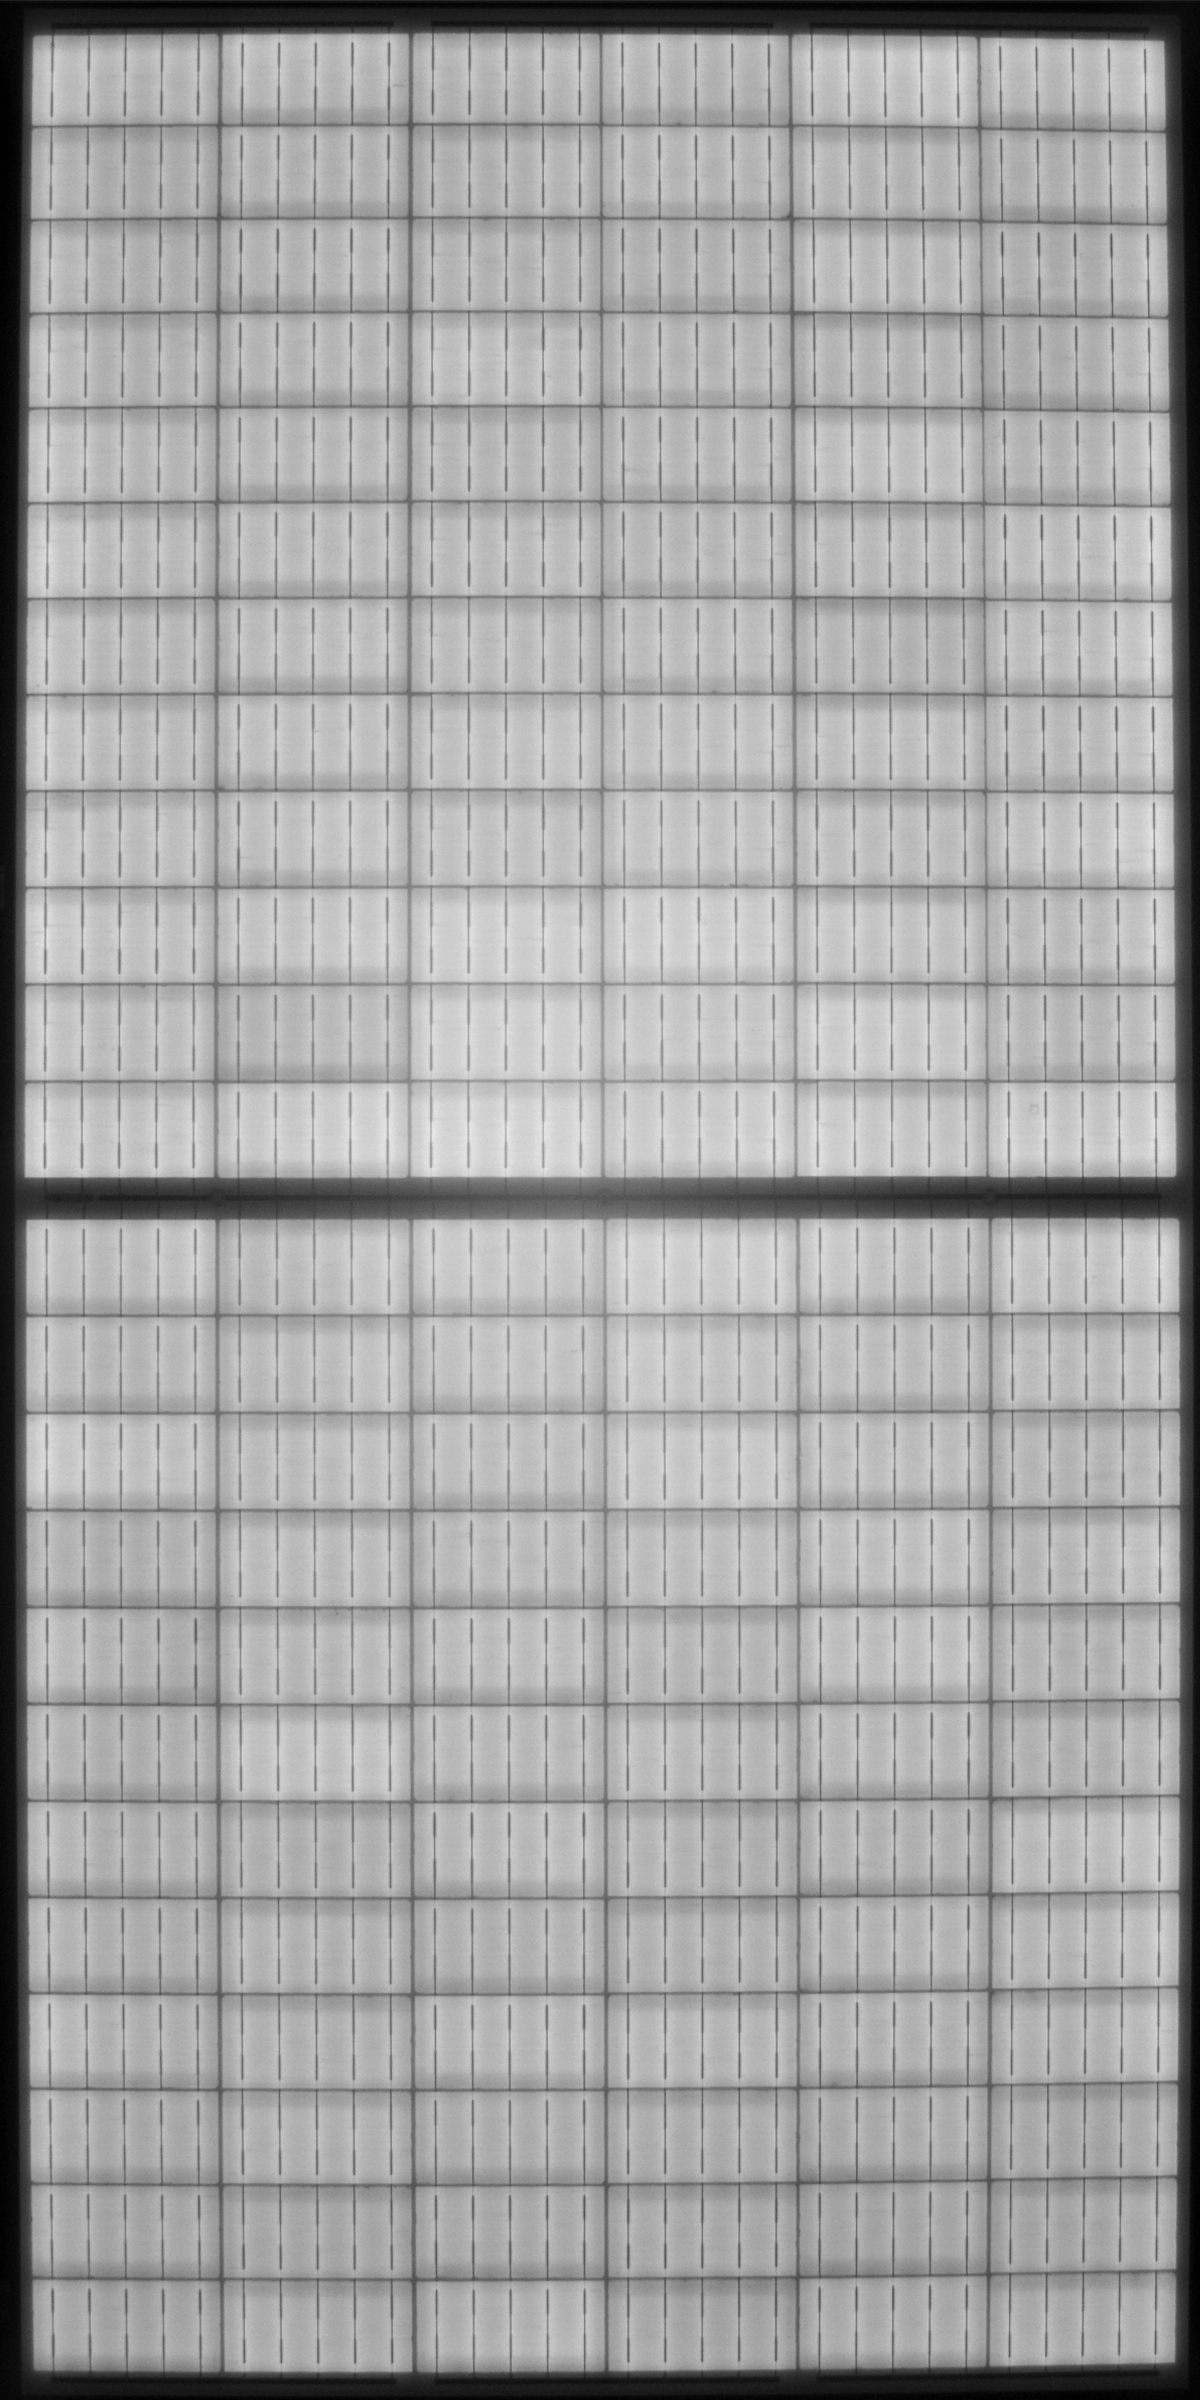
Prestress
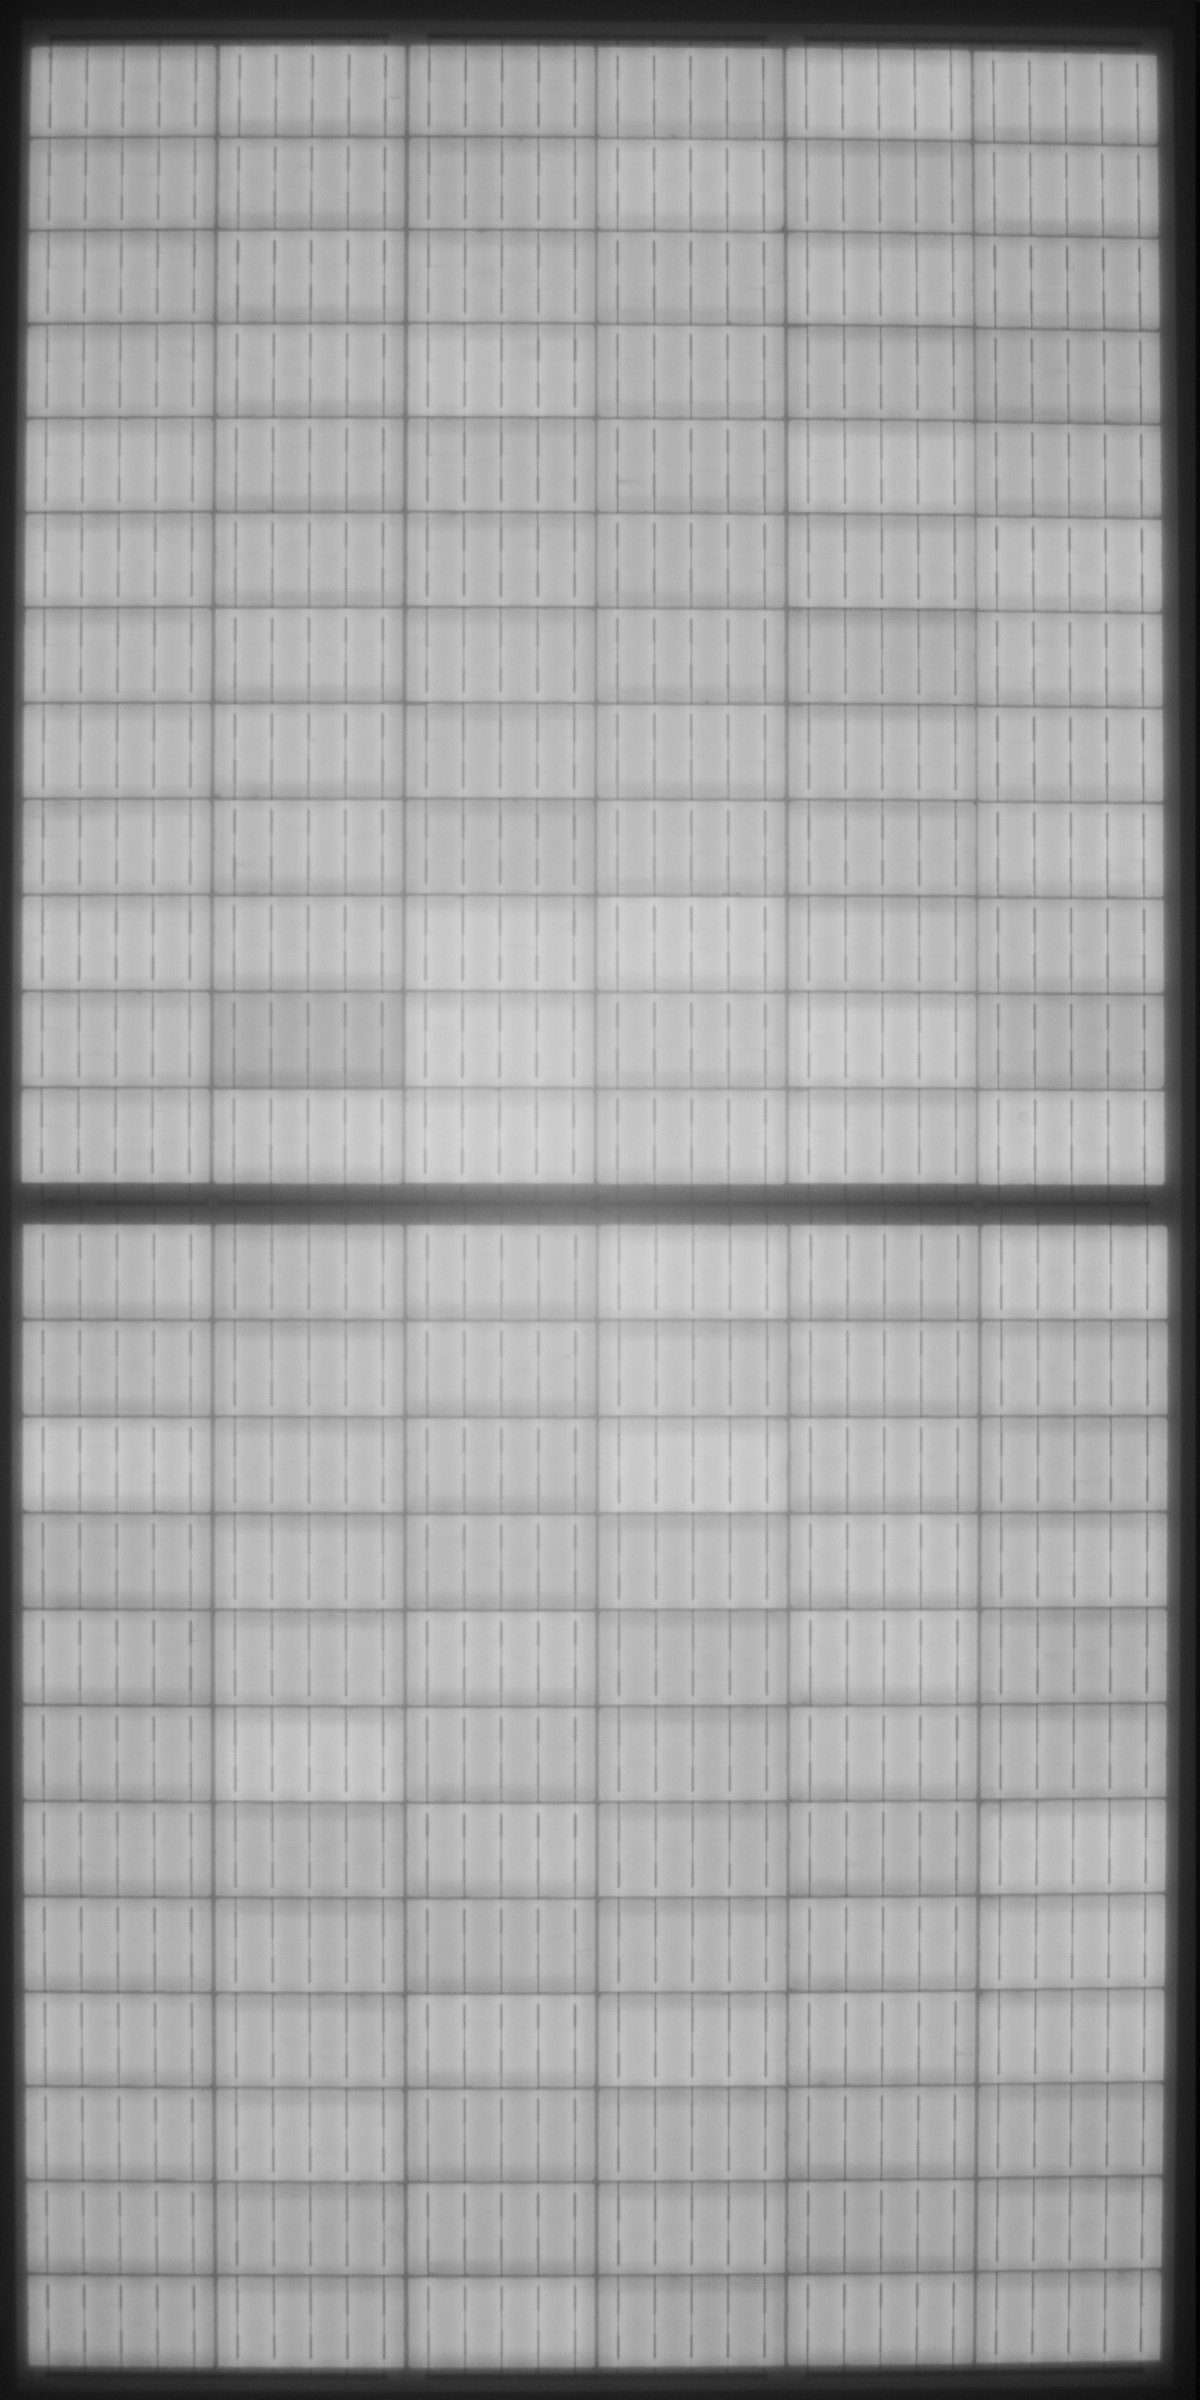
LID

LETID168
LETID486
LID/LETID Electrical Data:
LID: 1.0%
LETID168: 2.0%
LETID486: 3.4%
Learn something new?
Share it with your network.