

2021 PV Module Reliability Scorecard
PAN Performance
Key Takeaways
- Module performance continues to improve as shown by PVEL’s historical PAN test results. Relative low light efficiency is increasing each year as is power output at high temperatures.
- All 2021 PAN Top Performers are bifacial modules because of the energy yield boost from their rear-sides. The median bifacial energy generation was 7.3% higher than the median for monofacial for Las Vegas and 2.3% higher than the median for Boston.
- Bifacial performance varied between +1.2% and -1.1% from median for Las Vegas and +1.6% and -0.6% from median for Boston. For monofacial modules the range of performance was larger: +2.5% to -1.3% from median for Las Vegas, and +1.4% to -1.7% for Boston.
- To put these values in context, as stated in the LID+LETID example, a 1% change in performance can have a significant impact on project profitability, especially when that performance difference directly informs the energy models that determine project valuations.
- About half of the bifacial modules PVEL tested do not include a bifaciality specification on the datasheet. When this value was specified, 20% of BOMs had a PVEL-measured bifaciality at least 5% lower than claimed by the manufacturer.
- PVEL’s PAN files have strong agreement with field performance as shown when analyzing measured versus modelled results.
2021 Top Performers
Manufacturer
Model Types
Astronergy
CHSM72M(DG)/F-BH-xxx
Boviet
BVM6610M-xxxL-H-BF ;
BVM6612M-xxxL-H-BF-DG
BVM6612M-xxxL-H-BF-DG
ET Solar
ET-M672BHxxxTW
GCL
GCL-M6/72GDF
LONGi
LR4-72HBD-xxxM
Seraphim
SRP-xxx-BMA-BG
Note: Manufacturers are listed in alphabetical order. The tested product is listed first. Variants for which the test results are representative are listed in parentheses. In some cases, test results were not available at the time of publication.
Power Degradation for Each Model Type
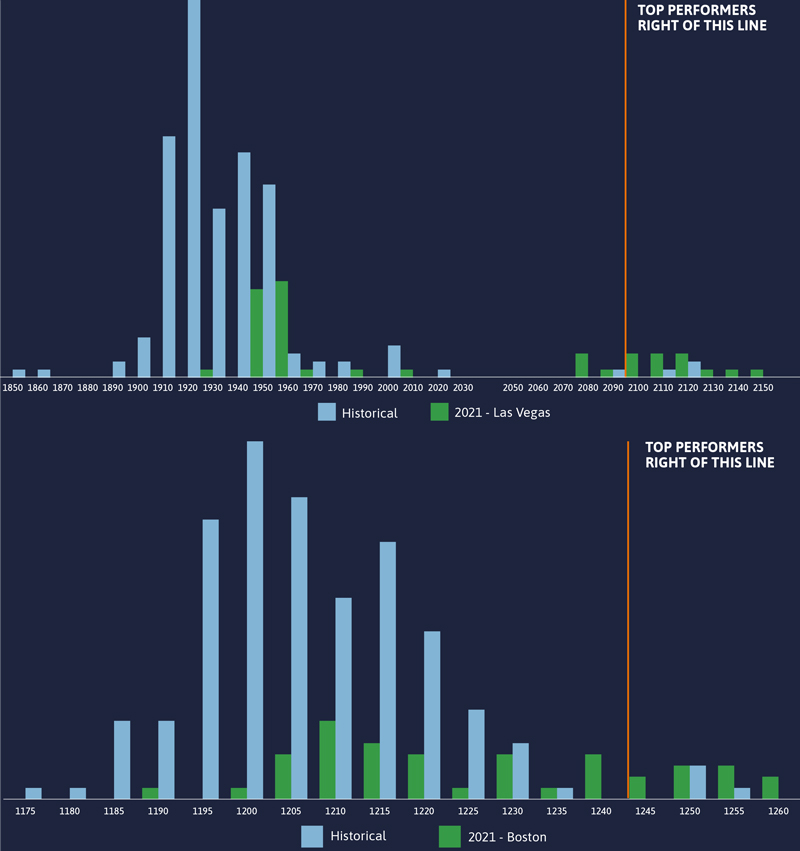
Each PAN report includes two site simulation results: a 1 MW site in a temperate climate at a 0° tilt in Boston, USA, and a 1 MW site in a desert climate at 20° tilt in Las Vegas, USA.
About the Test
Background of the Test
In PVsyst, an industry standard modeling program for predicting PV project performance, PAN files model irradiance- and temperature-dependent behavior of PV modules.
Module datasheet specifications can be used to generate a functional PAN file but may not define all module performance parameters sufficiently for the full range of potential irradiance and temperature conditions. PVEL measures these conditions in the lab to provide more accurate modelling inputs.
Test Procedure
Three identical PV modules are tested across a matrix of operating conditions per IEC 61853-1, ranging in irradiance from 100 W/m2 to 1100 W/m2 and ranging in temperature from 15°C to 75°C.
A custom PAN file is then created with PVsyst’s model parameters optimized for close agreement between PVsyst’s modeled results and PVEL’s measurements across all conditions.
Characterizing Performance from the Lab to the Field
Energy yield predictions factor heavily in procurement decisions, cost of capital calculations and risk assessments. A custom PAN file provided by PVEL that is based on laboratory-measured irradiance- and temperature-dependent behavior of the PV module will result in more accurate energy models. To better illustrate performance of optimized PAN files, each PAN report includes two site simulation results: a 1 MW site in a temperate climate at a 0° tilt (in Boston, USA), and a 1 MW site in a desert climate at 20° tilt (in Las Vegas, USA). Explore trends and findings from PVEL’s PAN characterizations below.
Improved Performance at High Temperatures
Module temperature coefficients continue to improve year over year, leading to increased power at higher temperatures.
This is most impactful for site locations with higher temperatures such as central India and the Middle East.

Maximum power temperature coefficient each year across PVEL’s PAN dataset.
Relative Efficiency vs Irradiance by Technology
While the benefit of low-light performance is beneficial to all PV plant locations, it is much more impactful in higher latitudes such as Boston or Northern Europe.
While the Al-BSF and PERC values are closely aligned for both mono- and multicrystalline technologies, as are the values for bifacial vs. monofacial for these technologies, there are significant differences between multi-Al-BSF/PERC, mono-Al-BSF/PERC (p-type) and mono-PERT (n-type).
Mono-PERC delivers stronger low light performance than multi-Al-BSF/PERC. This benefit will continue for buyers as manufacturers expand n-type PERT capacity.
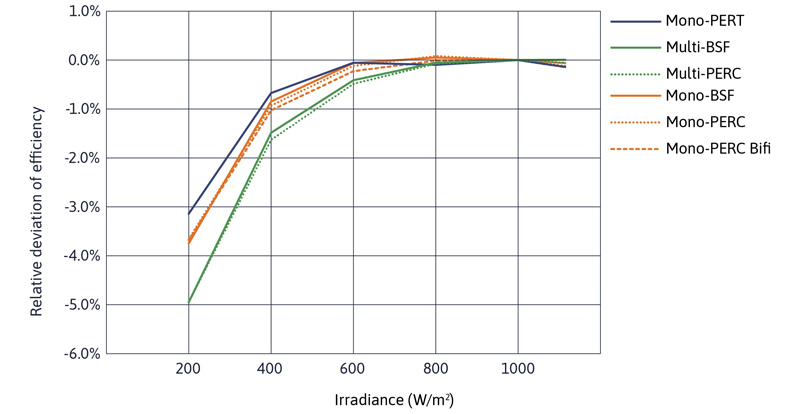
Average relative efficiency versus irradiance across different crystalline module technologies.
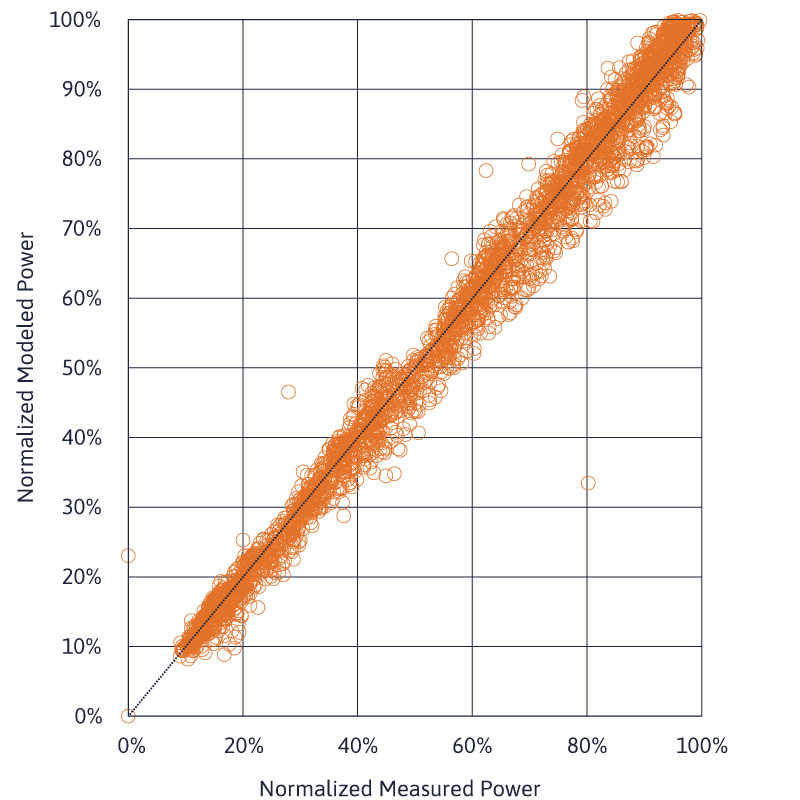
Measured vs. Modelled – Validating PVEL’s PAN Files
Results from field exposure testing at PVEL’s outdoor facility at PVUSA were used to assess the accuracy of PVEL’s lab-measured PAN files.
To validate these measurements, PVUSA site parameters and weather data were entered into PVsyst and the modeled results were compared to the total measured energy generation for a 12-month period.
In the example here, the expected power output generated by the model based on PVEL’s lab-measured PAN file was within 0.5% of the measured field results.
Learn something new?
Share it with your network.