

Certifications and warranties are important prerequisites for global market acceptance and financing of solar PV technologies. However, certifications do not ensure PV module reliability and warranties do not provide full protection for asset owners when failures occur in the field.
2021 PV Module Reliability Scorecard
Why Testing Matters
The Limits of Warranties and Certifications
Industry Perspective: PVEL’s Data De-risks Investments
”As PV manufacturing capacity expands, mega-scale, 100+ MW projects financed by risk-averse traditional investors are the new norm. Yet the most innovative technologies are unproven in the field. We trust PVEL for the technical data we need to de-risk Primergy’s 2GW project pipeline.
Adam Larner, Chief Operating Officer of Primergy Solar
Primergy is a wholly owned subsidiary of Quinbrook Infrastructure Partners, a global investment manager with $8B invested in 19GW of power generation.
![]()
Source Details
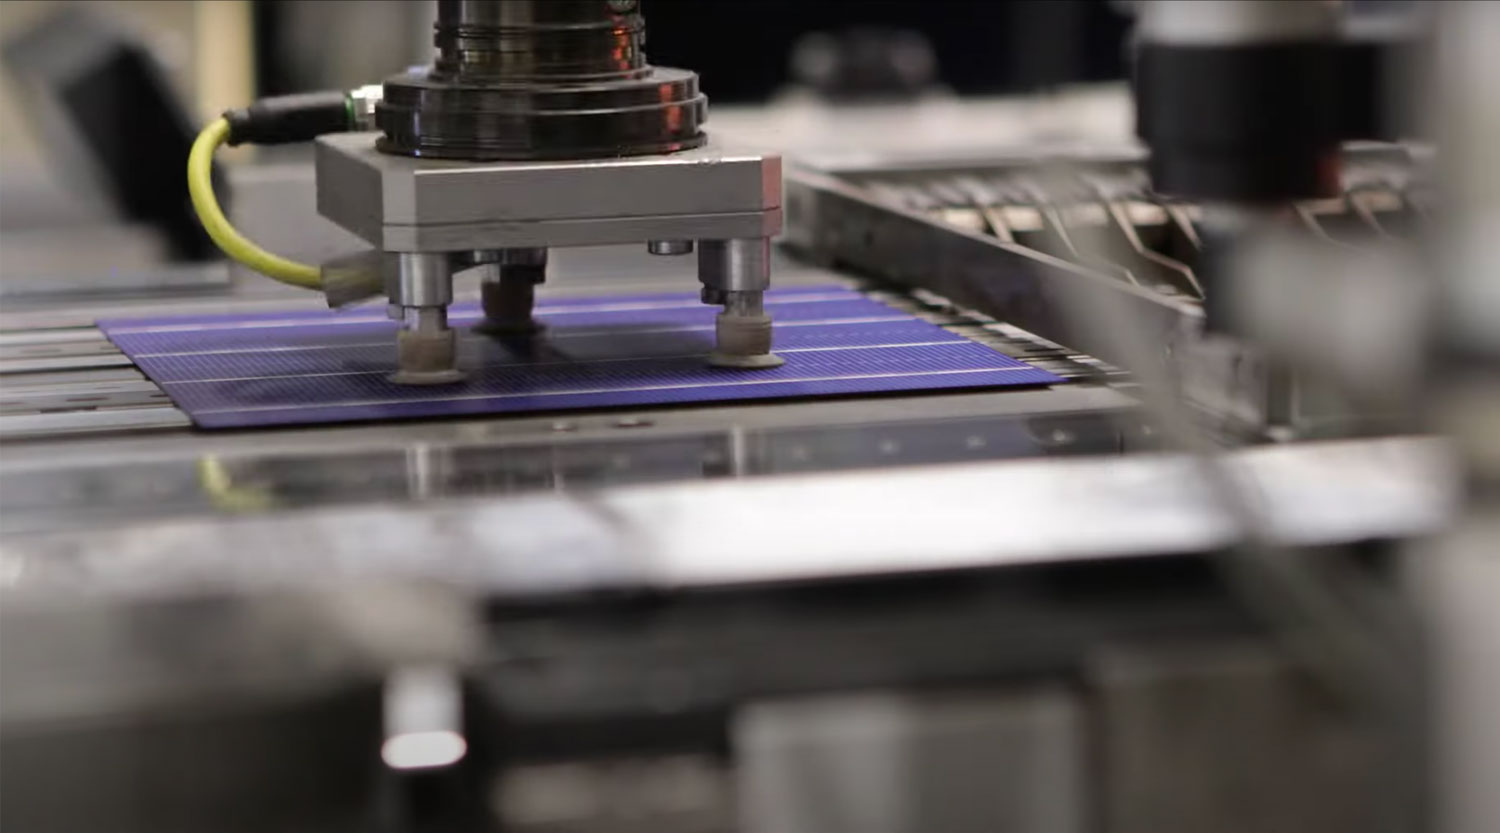
Industry Perspective: Defects from the Factory to the Field
Pre-shipment defects vs. manufacturer size
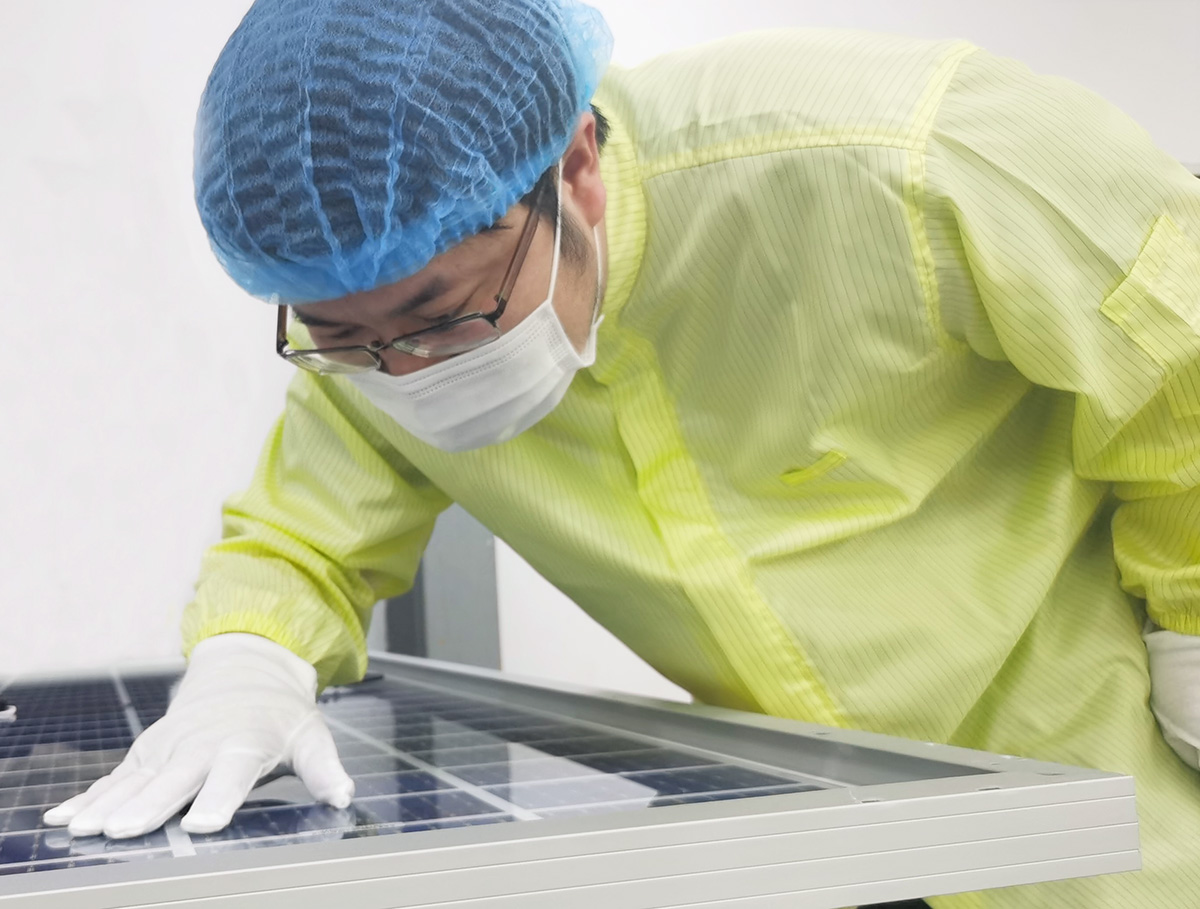
Photo courtesy of PI Berlin.
Even certified modules can contain both overt and latent defects which are not easy to detect once modules leave the factory.
PI Berlin has evaluated more than 90 GW of production quality and audited 300+ factories worldwide. Results from PI Berlin’s regular in-factory inspections show that defect rates in new build modules remain variable and range from less than 1% to over 5% depending on the specific manufacturer.
The results also demonstrate that higher quality is not always associated with larger manufacturers, which are those that accounted for > 75% of PV module shipment volumes in 2020.
Major defects are defined as those which have the potential to impact module performance and reliability.
The industry’s largest manufacturers are represented in blue. They are defined as those that collectively accounted for >75% of 2020 shipment volumes.
The data in the chart represents major defect rates by manufacturer and is based upon the results of recent pre-shipment inspections on over 84,000 modules sampled from production of more than 6 GW produced for major projects in the U.S.

The failure rates by manufacturer are shown here.
To be counted in this dataset, the defect must have been missed during the manufacturer’s final flash, EL, or visual inspection.
The most common defects are related to the cells and cell circuit, including the cell inter-connects and layout. These defective modules are identified and screened out by third-party inspections, but in cases where no third-party inspection is conducted, these defective modules could be shipped to a field site.
Although third-party inspections and oversight have become more common in the past few years, constant changes in technology, materials, and manufacturing processes mean that maintaining consistent quality remains an ongoing challenge.
Contributed by Ian Gregory, PI Berlin
Contributed by Ian Gregory, Managing Director, PI Berlin North America
![]()
Source Details
Industry Perspective: Defects from the Factory to the Field
Field reliability vs. manufacturer size
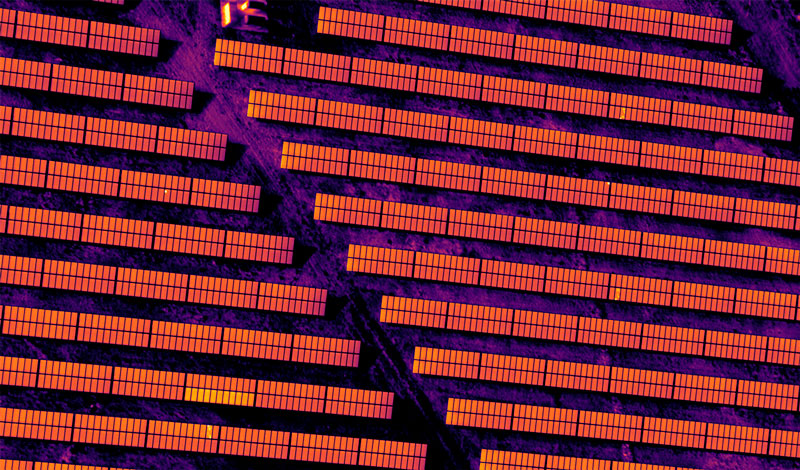
Photo courtesy of Heliolytics.
Heliolytics has aerial-infrared scanned 3,600 operating PV systems globally, representing over 39 GW. Aerial infrared scans identify defects in PV modules that cannot be seen by visual inspection.
Analysis of this data reveals that manufacturer size does not correlate with field reliability.
The chart below shows mean and median sub-module failure rates per site by module manufacturer.
These are failures with at least one-third of the module in short circuit, leading to at least a 33% drop in module power. They are a good indicator of major reliability issues caused by poor soldering, diode failures, backsheet, and/or cell reliability issues.
The mean value for submodule faults per site provides a good representation of portfolio performance. The median value is more reflective of a single site. The submodule fault results for the top ten largest manufacturers by 2020 shipping volume are interspersed across the graph. This data indicates that the size of a manufacturer is not a consistent indicator of reliability or quality.
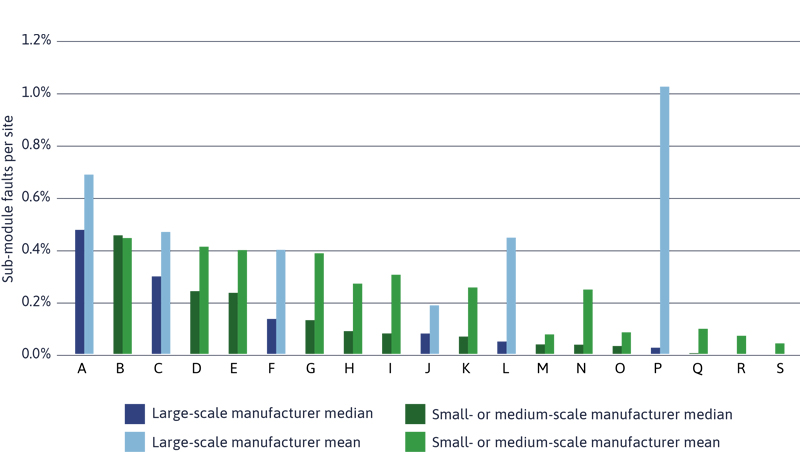
Submodule defect rates per site by manufacturer are shown here.
This analysis is restricted to manufacturers for which Heliolytics has scanned at least 200,000 modules or 20 sites. The 10 largest manufacturers by 2020 shipment volume are segmented.
Key Takeaway
Product quality needs to be well-controlled as manufacturers expand production capacity.
Industry Perspective: Best Practices for Warranty Claims
As an asset owner and third-party O&M provider for more than 3GW of solar power plants in the U.S., Strata Solar has supported dozens of PV module warranty claims across many manufacturers.
Understanding Warranties
Usually Included
Usually Not Included
Power output (25+ years)
Cost of diagnosis and lab testing
Workmanship (10 years)
Cost of gathering evidence
Replacement modules or cash compensation
Lost energy
Evidence and testing requirements by failure mode
Module removal and reinstallation
Filing Warranty Claims
Selectively and strategically filing claims is critical because claim submission and adjudication costs can exceed compensation from the warranty. Success requires close attention to detail at every stage of the project. Claims are more likely to be cost-effective when stakeholders:
Understand the Warranty
Fully understand all warranty terms before internal investigations begin.
Maintain Records
Maintain comprehensive records for all stages of a project.
- Create site maps with module serial numbers.
- Document maintenance granularly.
- Log all previously replaced PV modules.
- Store all historical testing records.
Document the Warranty
Record and document the warranty claim process.
- Save all communications.
- Send memos following phone calls.
- Continue documenting test results at the module level.
- Update site maps as modules are removed and replaced.
Ultimately, asset owners cannot rely on warranties alone for full compensation when PV modules underperform or fail in the field.
Contributed by Mike Loeser, Strata Solar Services
Contributed by Mike Loeser, Sr. Director, Operations & Maintenance, Strata Solar Services
![]()
Source Details
Learn something new?
Share it with your network.