2021 PV Module Reliability Scorecard
Potential-Induced Degradation (PID)
Key Takeaways
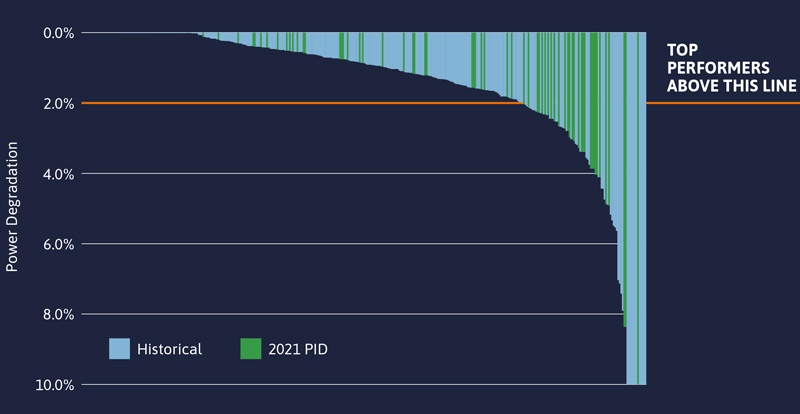
- Many module datasheets continue to advertise products as “PID resistant”, yet both the median and average degradation from PID was higher in the 2021 Scorecard dataset than in the 2020 Scorecard dataset—the highest in PVEL’s history.
- Manufacturers are producing more modules that are inherently susceptible to PID, and some are clearly struggling with mitigation.
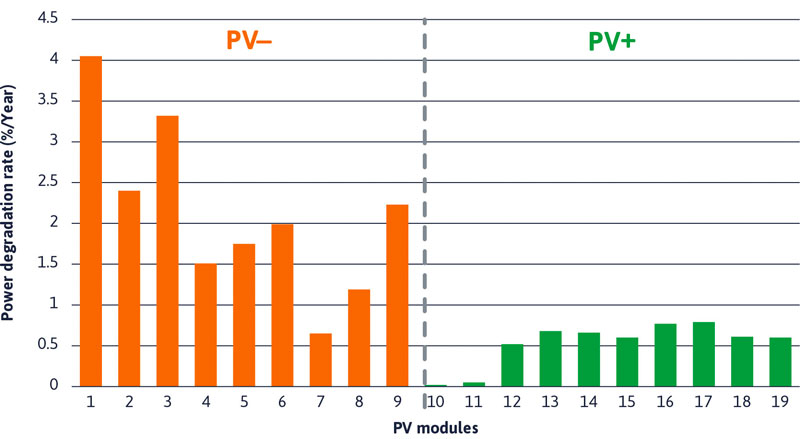
- The results presented here are based on PID testing with negative voltage applied between the cells and the frame. The PQP also includes PID testing on two additional samples with positive voltage applied. These PID+ results are typically the same or better than the PID- results that are shown here.
- PID susceptibility of bifacial modules continues to be mixed. Many of the Top Performers are bifacial with both glass//glass and glass//backsheet configurations, yet there are bifacial modules with more than 4% front-side degradation. Rear-side degradation is also mixed, ranging from 0% to >15%. Some of this may be due to PID-polarization. More research is needed on the field-relevancy of this phenomenon.
- One solution to PID is through system design, including the use of specific grounding configurations or distributed electronics. PVEL recommends that developers and EPCs evaluate these alternative solutions if PID-resistant modules are not being procured for a project.
2021 Top Performers
Manufacturer
Model Types
BVM6612M-xxxL-H-BF-DG (BVM6610M-xxxL-H-BF-DG)
JKMxxxM-7RL3-V (JKMxxxM-6RL3, JKMxxxM-6RL3-B)
LR4-72HIBD-xxxM (LR4-60HIBD-xxxM) ;
LR6-72HPH-xxxM (LR6-60HPH-xxxM, LR6-60HPB-xxxM)
SPR-P3-xxx-COM-1500 (SPR-P3-xxx-BLK, SPR-P3-xxx-BLK-E3-AC)
Q.PLUS DUO L‐G5.2 (Q.PLUS DUO-G5) ;
Q.PEAK DUO L‐G5.2 (Q.PEAK DUO-G5) ;
Q.PEAK DUO BLK‐G6+ (Q.PEAK DUO‐G6+, Q.PEAK DUO BLK-G6+/AC, Q.PEAK DUO L-G6.2) ;
Q.PEAK DUO BLK-G6+/SC ;
Q.PEAK DUO-G7 (Q.PEAK DUO L-G7) ;
Q.PEAK DUO BLK ML-G9+ (Q.PEAK DUO XL-G9.2)
TP3M Black
Note: Manufacturers are listed in alphabetical order. The tested product is listed first. Variants for which the test results are representative are listed in parentheses. In some cases, test results were not available at the time of publication.
About the Test
Background of the Test
Potential-induced degradation (PID) has emerged over the past 10 years with the development of higher system voltages and ungrounded systems. PID can occur within weeks or even days of commissioning. It generally occurs when the internal PV electrical circuit is biased negatively in relation to ground.
The voltage between the frame and the cells can cause sodium ions from the glass to drift toward the cell surface, which typically has a silicon nitride (SiN) anti-reflective coating. If pinholes, also known as shunts, in this coating are large enough to allow sodium ions to enter the cell, then performance can be irreparably impaired. Additionally, this voltage can cause a buildup of static charge, which can also reduce performance, although this effect is typically reversible.
Test Procedure
Once the module is placed in an environmental chamber, the voltage bias equal to the maximum system voltage rating of the module (-1000V or -1500V) is applied with 85°C and 85% relative humidity for two cycles of 96 hours.
These temperature, moisture, and voltage bias conditions help evaluate possible degradation and failure mechanisms related to increased leakage currents.
Lessons Learned from Failure
The Problem
For all types of PID, the voltage potential of the internal circuit relative to ground can cause power degradation across the irradiance range. The degradation of shunting is partially recoverable, though low irradiance performance is more severely affected and nonrecoverable.
Projects Facing the Greatest Risk
PID can significantly diminish module performance in systems with transformerless inverters, which are electrically ungrounded. These systems are common in Europe and on rooftops around the world. Systems with central inverters often have negative grounding that protects against PID.
How to Detect Failure
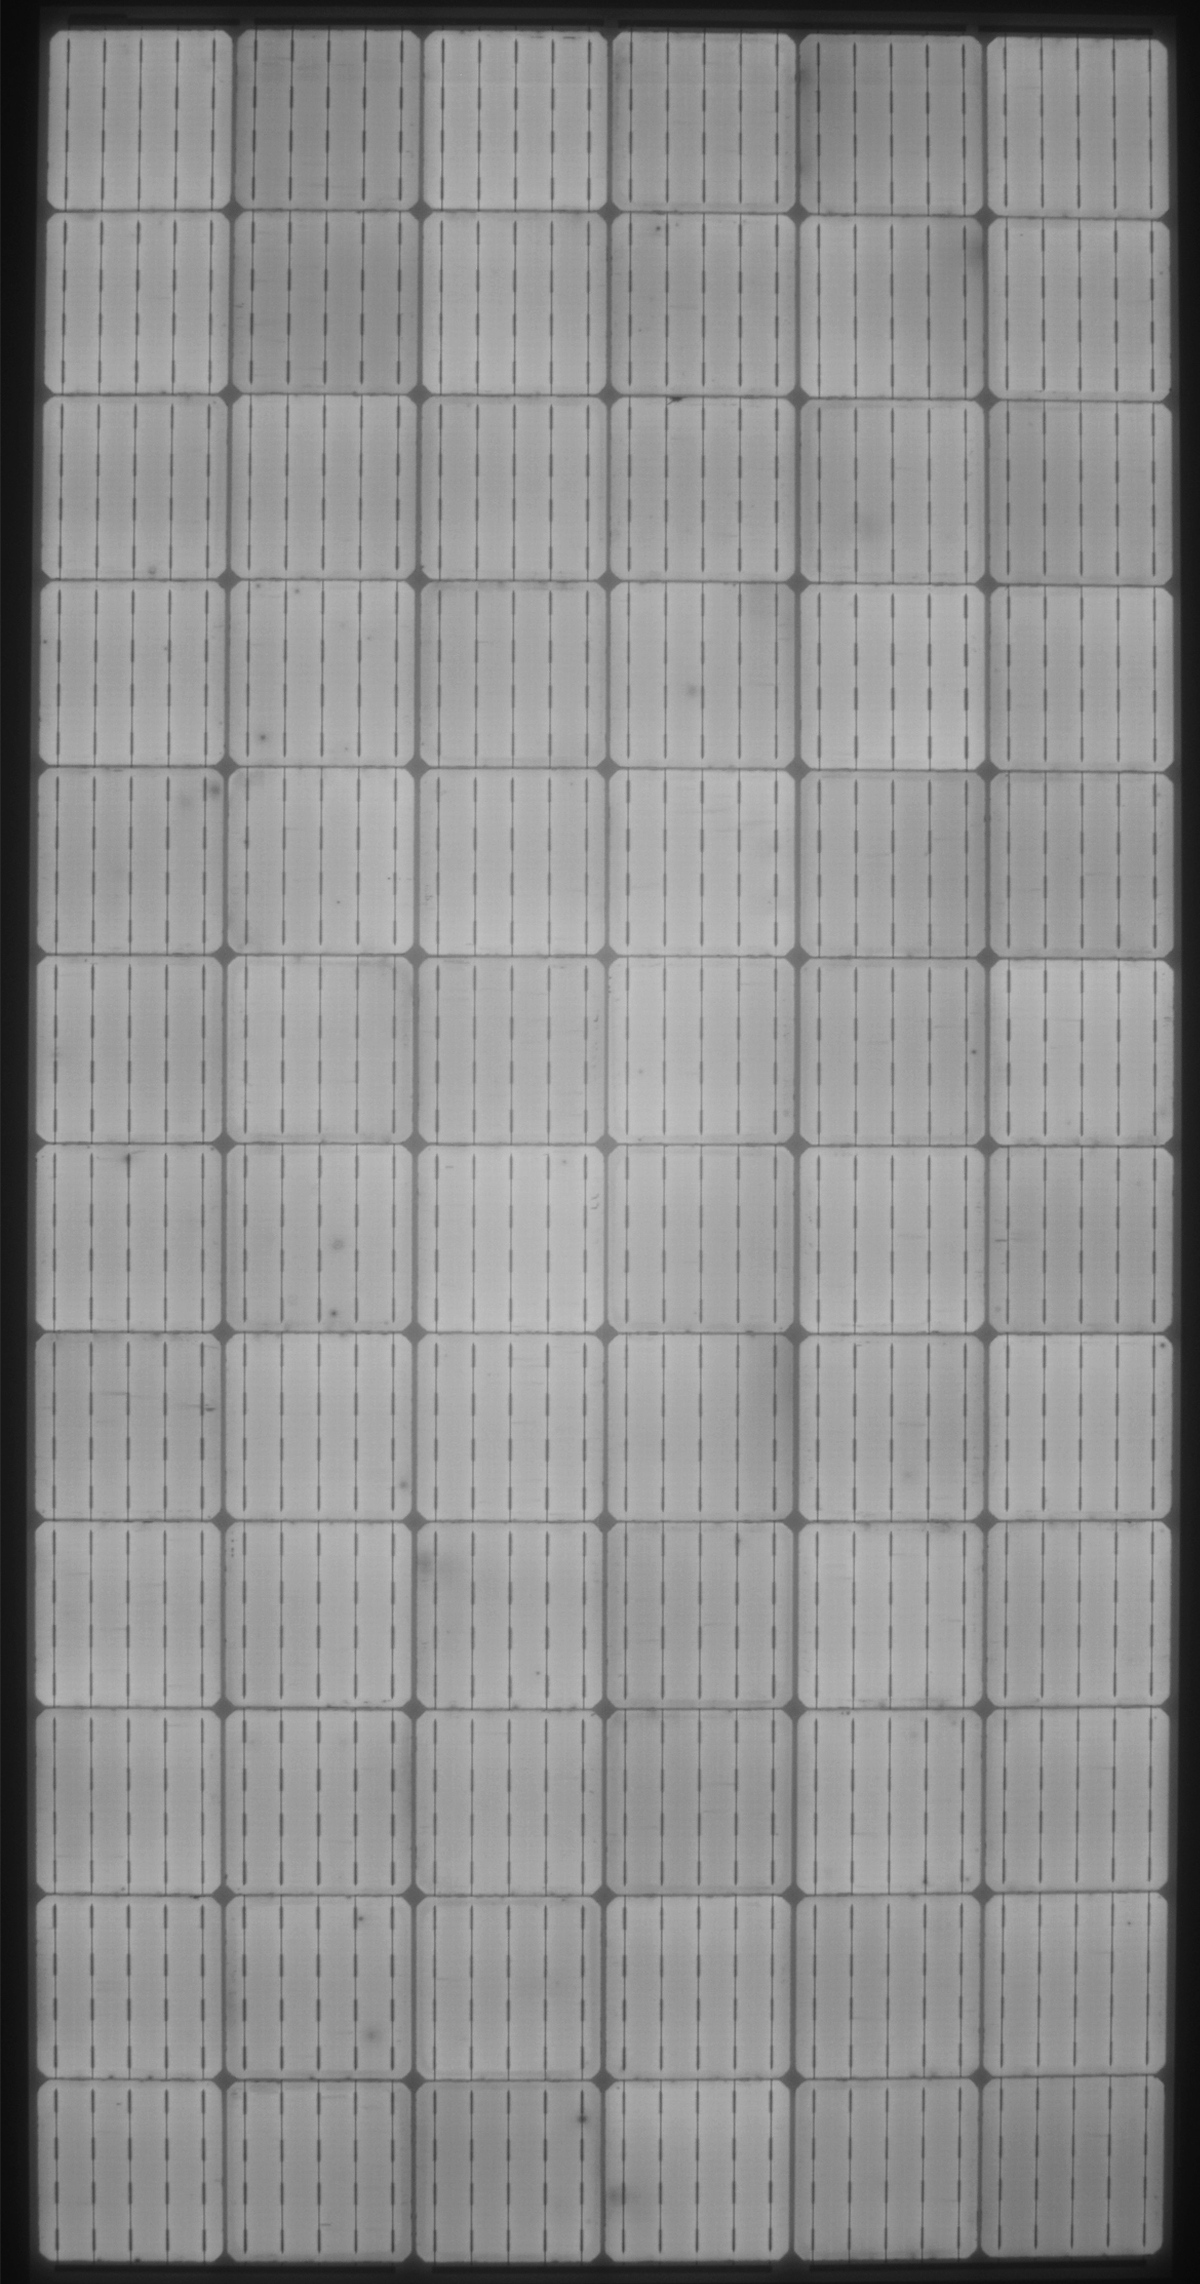
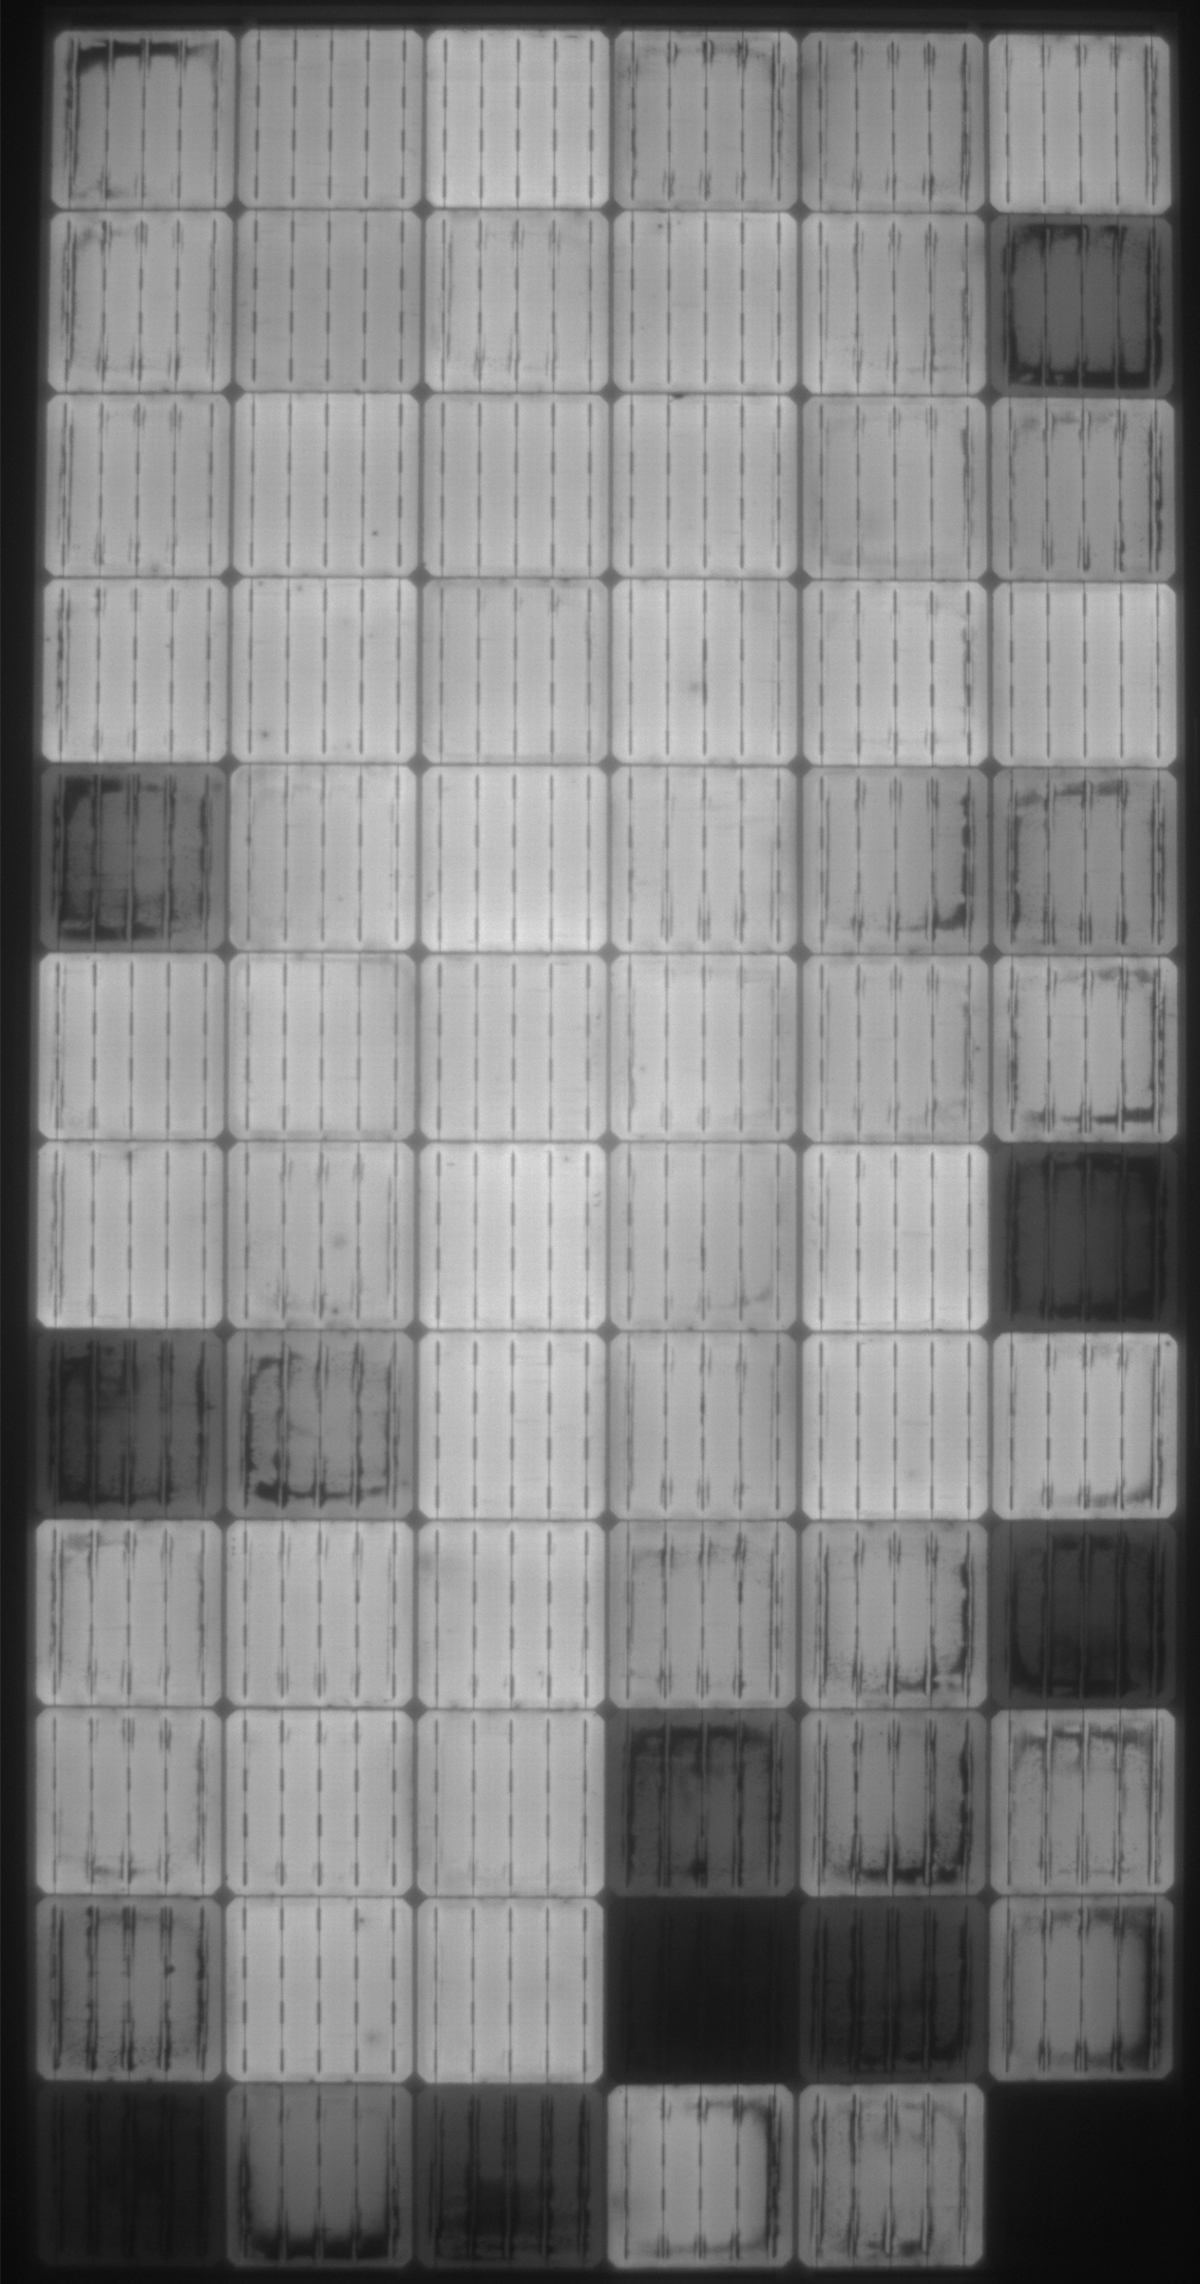
Compare prestress EL images with images after the PID test sequence. Where degradation has occurred, the entire cell surface appears darker. Analysis of current-voltage (IV) curves and infrared (IR) images can also reveal PID.
An Example from the Field
System size: 22.2 kW
Type: Ground-mount
Location: Southwestern Morocco
Failure mode: PID
A recent study from Morocco evaluated PID in a two-year-old grid-connected project located in semi-arid environmental conditions at a research facility. Module-level degradation was measured through electrical characterizations and field EL imaging. Annual degradation rates varied between less than 1% and 4%, with higher degradation occurring in modules located on the negative half of the 1000V string.
Source Details
An Example from the Lab
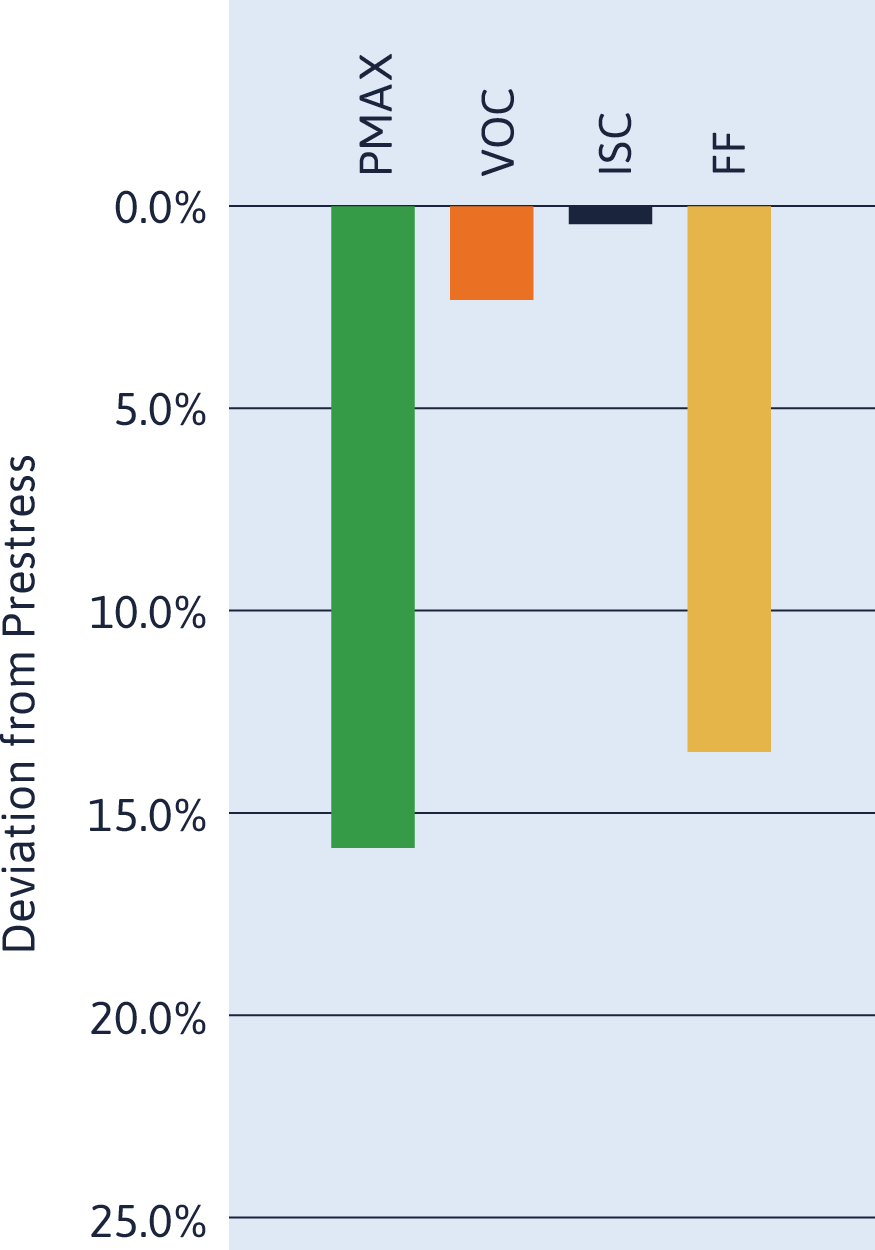
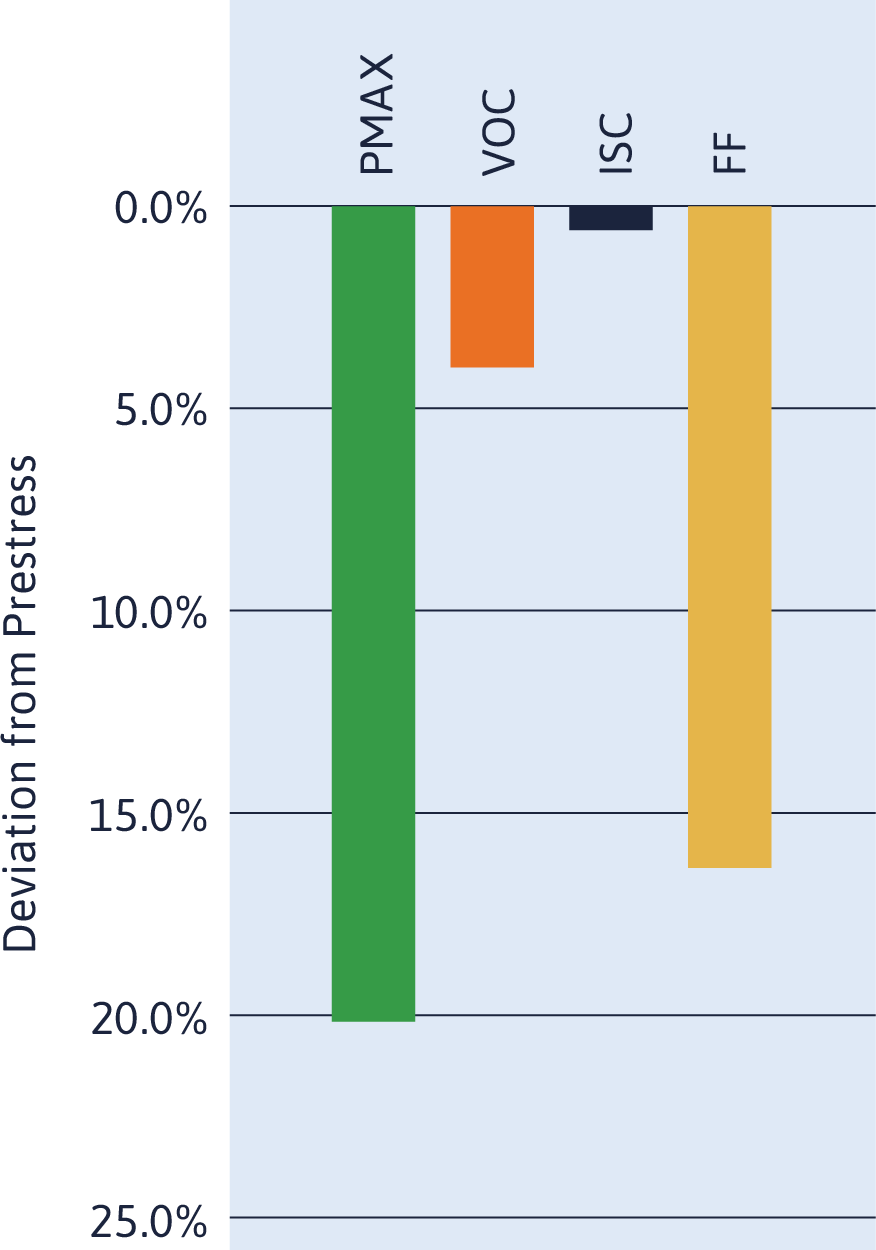
In the images shown here, power has dropped 15.9% after the first 96 hours in the test sequence. After an additional 96 hours, power is 20.2% less than the pre-stress condition.
To complement the PQP and to check for manufacturer consistency, PVEL performs reliability testing on a statistically relevant sample of PV modules procured for a specific project. In one case, two batches of modules with the same datasheet and the same nameplate showed extreme differences in PID susceptibility. All of the modules in one batch recorded power degradation in excess of 14%. In the other batch, all modules had less than 1% degradation. This came as a surprise to the manufacturer, who has used the term “PID resistant” in product marketing and did not anticipate any differences in the two batches.
Power Degradation After:
96 hours: 15.9%
192 hours: 20.2%
Learn something new?
Share it with your network.


