2021 PV Module Reliability Scorecard

Methodology

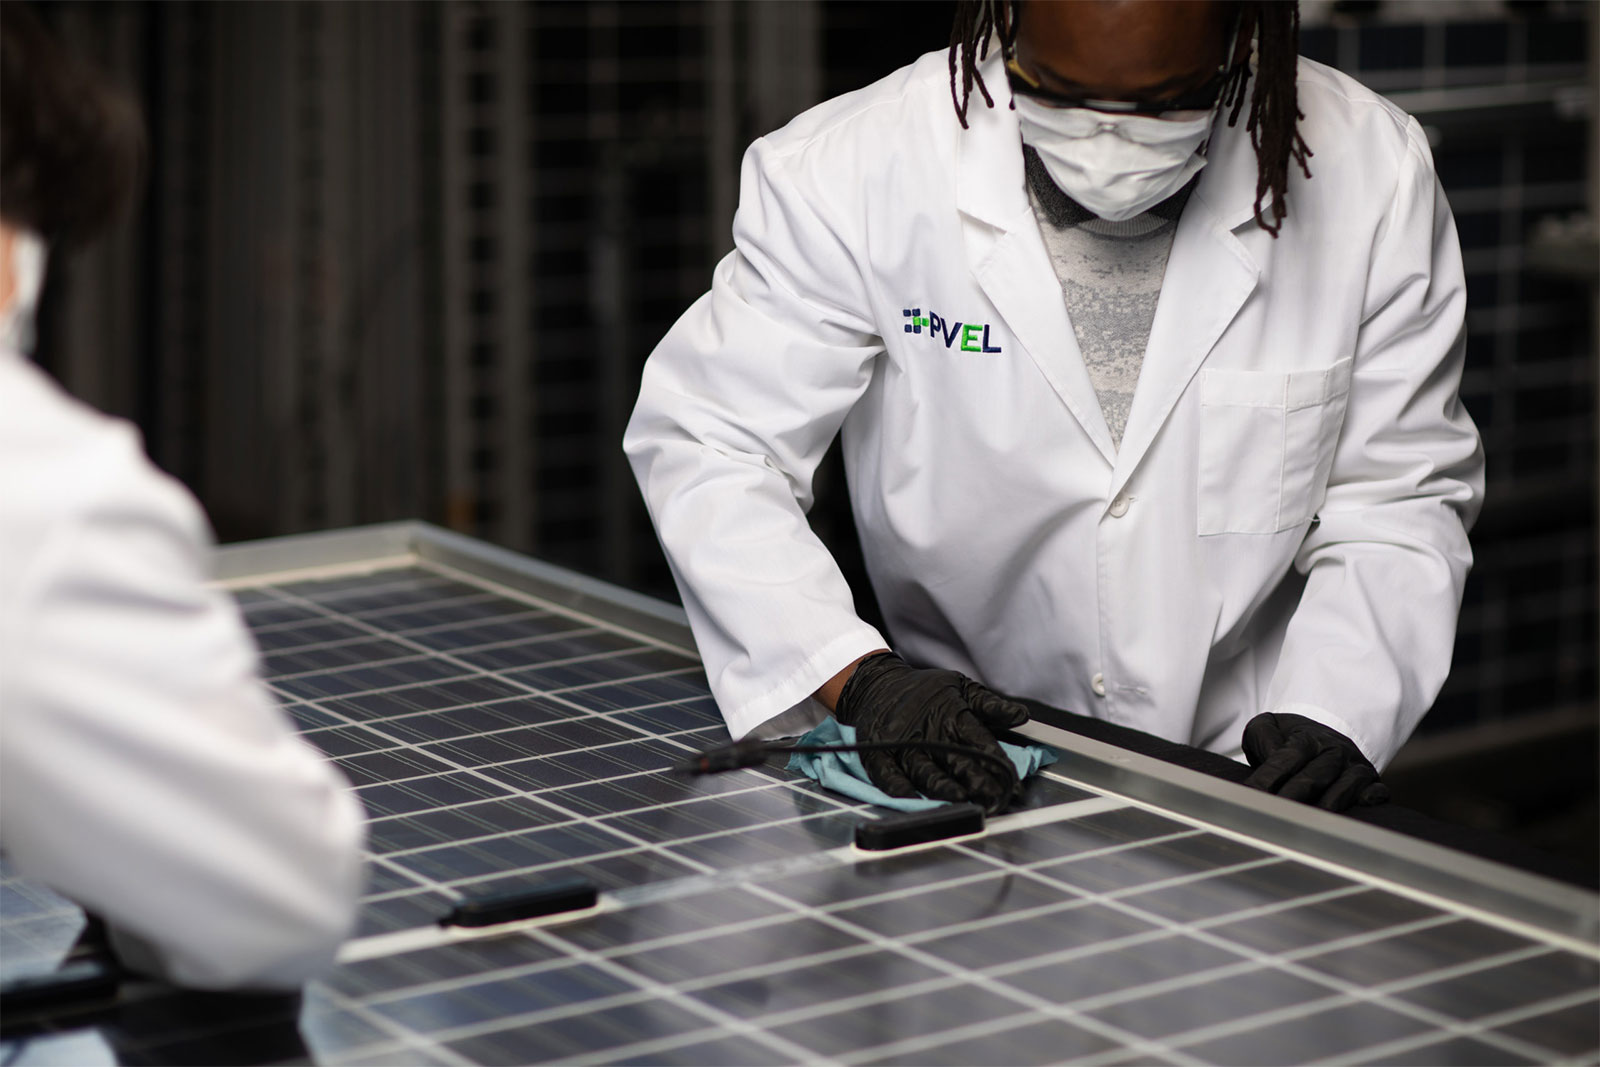
PVEL PV module visual inspection
Scorecard Rankings

Scorecard rankings are based on results from PVEL’s Product Qualification Program (PQP) for PV modules. The program, established in 2012, provides independent reliability and performance data and recognition for manufacturers who excel in testing.

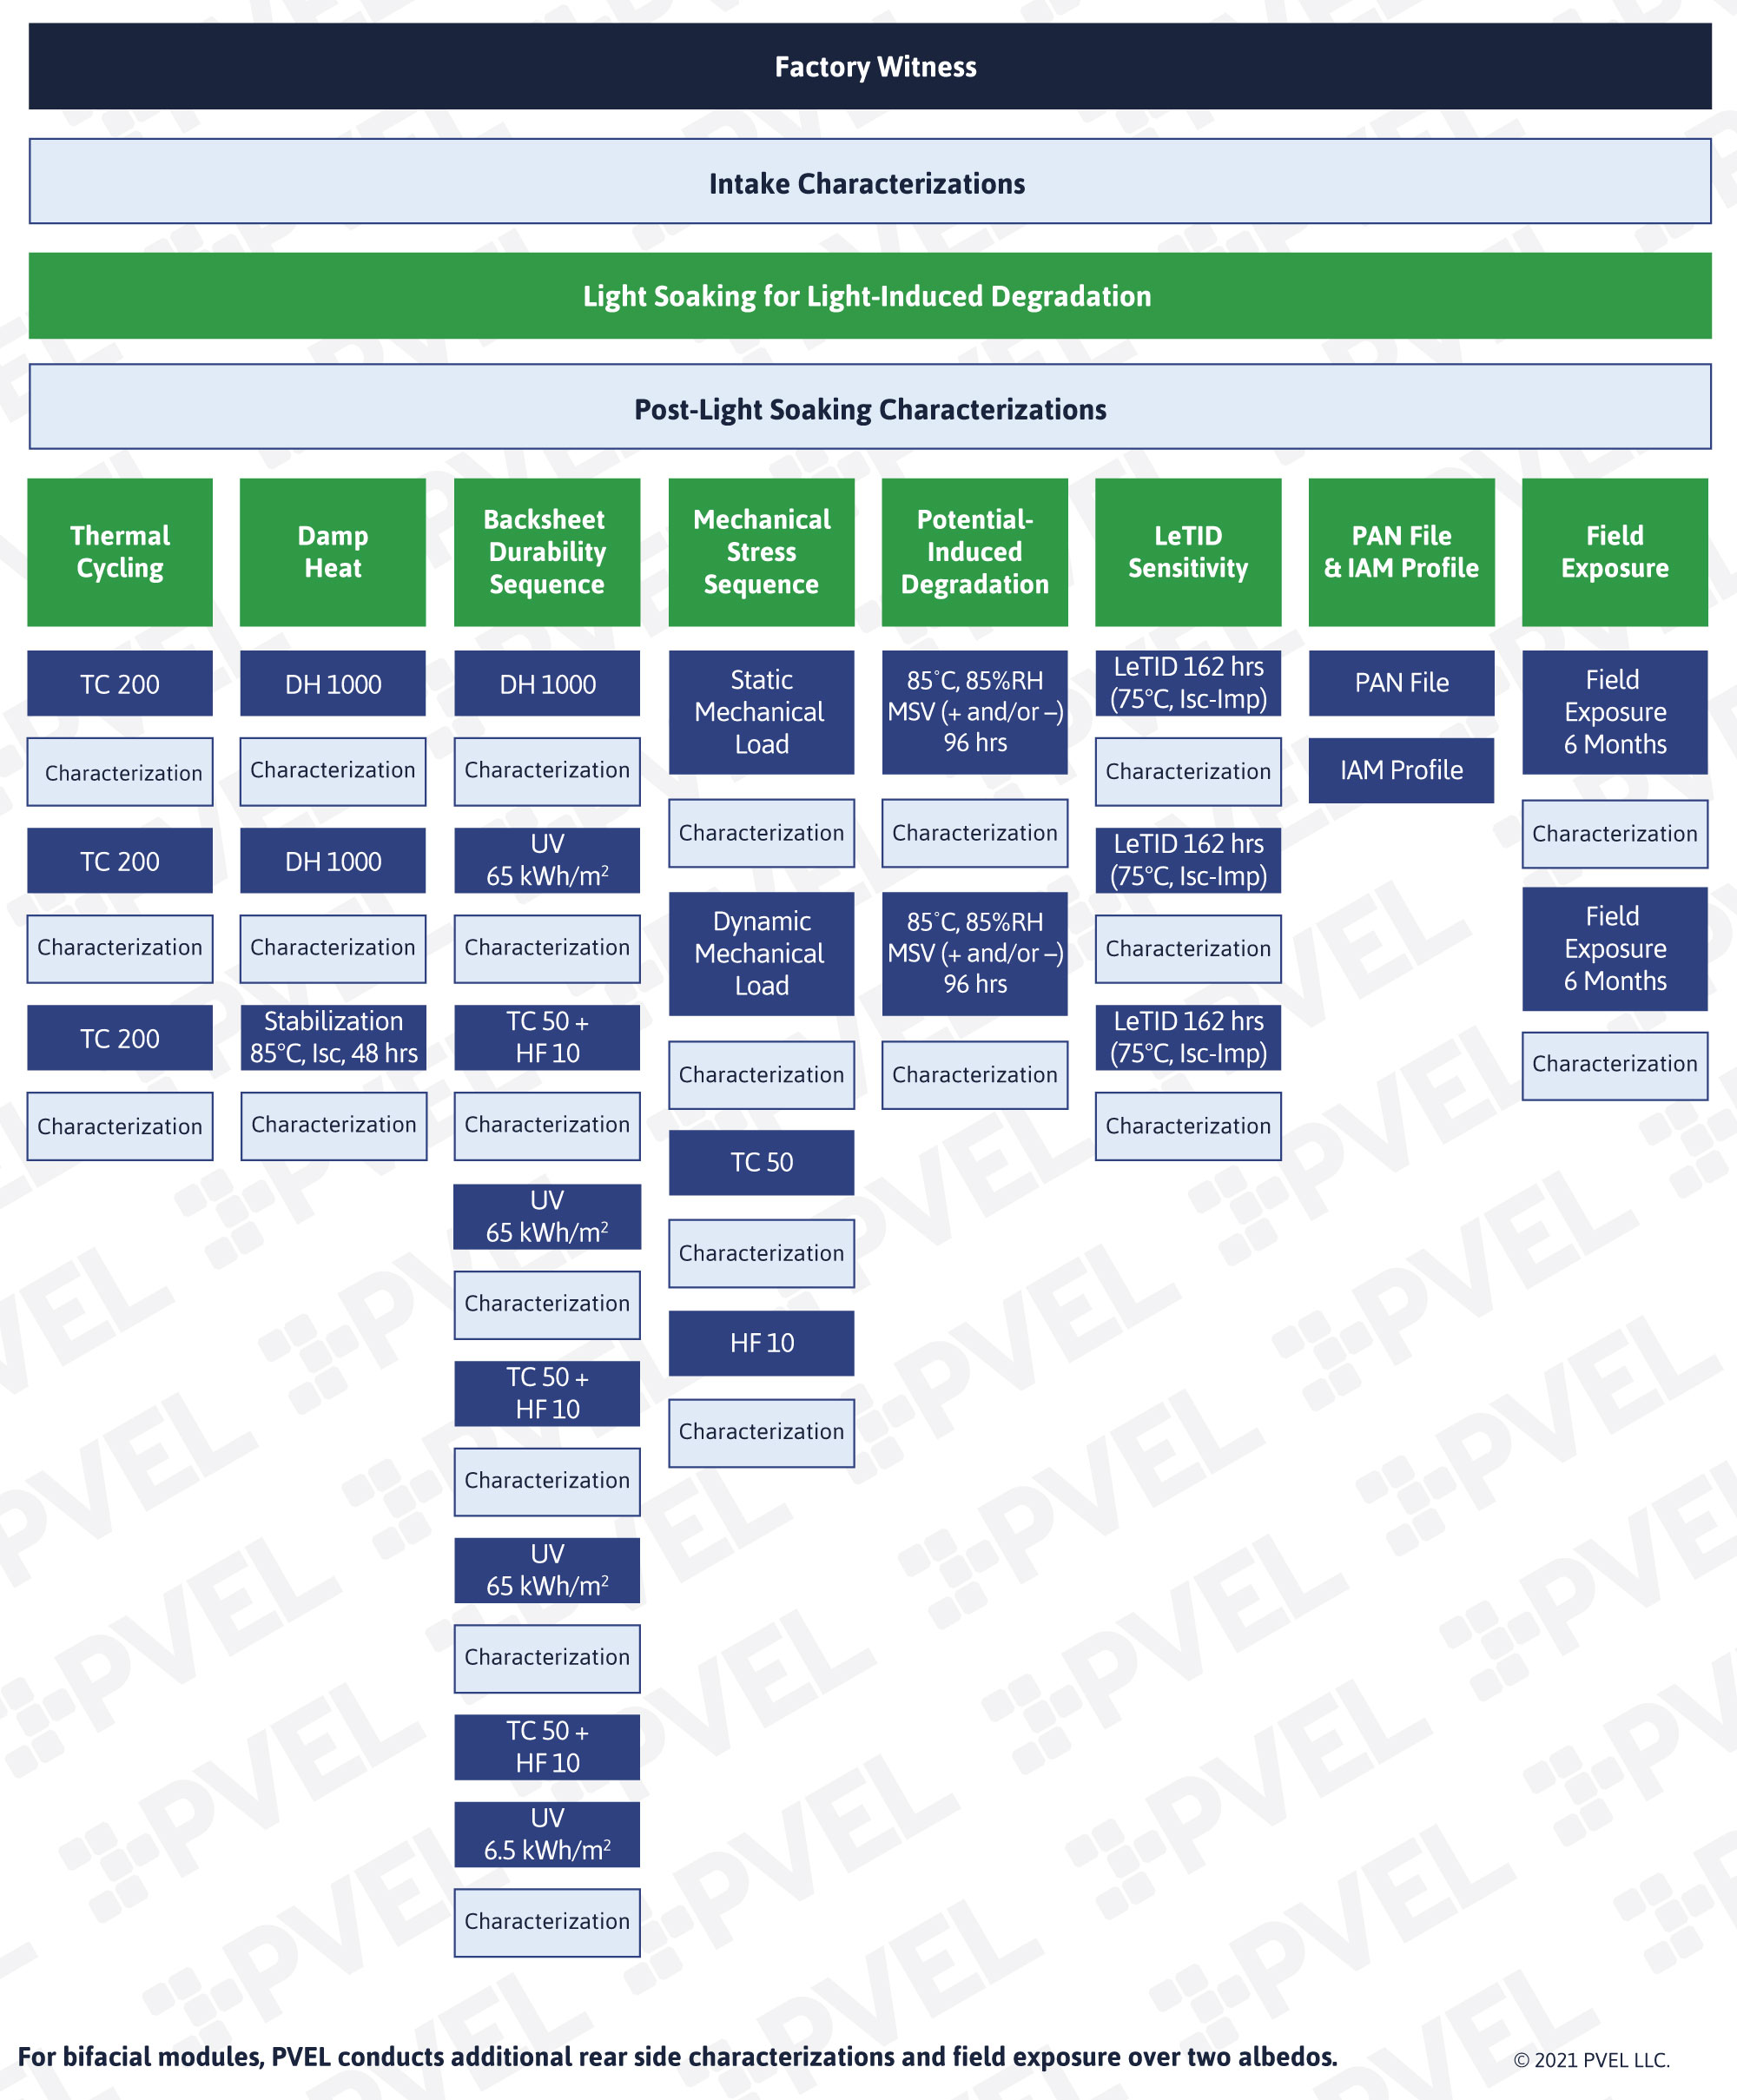
PQP starts with PVEL’s factory witness, where auditors monitor production and record the bill of materials of every module submitted for testing. Following shipping, PVEL measures power output and assesses the physical condition of each module before conducting extended reliability and performance testing. See the PQP diagram below for the complete test program.

Developers and investors around the world now require PQP for procurement risk mitigation. Join PVEL’s Downstream Partner Network to receive free access to PQP reports.

SIGN UP

Since Boviet began PQP testing with PVEL in 2018 our sales have increased by over 100%. The PVEL PQP quickly became instrumental to our long-term growth strategy: PVEL’s trusted and independent product validation is now fundamental in Boviet’s go to market strategy for all of our products.

Sienna Cen, President – Boviet Solar USA

The four principles that guide the PQP.

The PQP supports solar equipment buyers, investors and asset owners with a methodical test program that enables objective supplier evaluations and rigorous due diligence. Four principles guide the PQP.

Empirical Data

The PQP provides empirical metrics for revenue and energy yield modeling.

No Hand-picked Samples

Auditors witness production of all test samples and record bills of materials (BOMs).

Standard Processes

The PQP tests all BOMs in the same way with calibrated equipment and in consistent test environments.

Regular Program Updates

Test sequence updates provide data on new technologies and manufacturing techniques.

The four principles that guide the PQP.

The PQP supports solar equipment buyers, investors and asset owners with a methodical test program that enables objective supplier evaluations and rigorous due diligence. Four principles guide the PQP.

Empirical Data

The PQP provides empirical metrics for revenue and energy yield modeling.

No Hand-picked Samples

Auditors witness production of all test samples and record bills of materials (BOMs).

Standard Processes

The PQP tests all BOMs in the same way with calibrated equipment and consistent test environments.

Regular Program Updates

Test sequence updates provide data on new technologies and manufacturing techniques.

Factory Witness

PVEL auditors follow an eight-step process to inspect PV module factories and verify the BOM.

PV Cell Manufacturing
  1. Conduct a high-level process audit of the factory.
  2. Photograph BOM components as materials are removed from original packaging.
  3. Observe and record over 100 technical details about the BOM.
  4. Strictly track each BOM component through every step of production.
  5. Collect backsheet, encapsulant and connector samples.
  6. Document recipes for soldering and laminating.
  7. Sign each module and seal pallets with tamperproof tape.
  8. Ship pallets directly to PVEL for PQP testing.

Buyers should specify approved BOMs in supply agreements to make sure they procure modules that performed well in PQP testing. Ask PVEL for free, detailed BOM listings to accompany supply agreements.

Industry Perspective: Inside the Factory

Clean Energy Associates (CEA) has completed more than 45 GW of quality assurance (QA) audits at 350 factories worldwide. PVEL recommends QA audits to buyers as a procurement best practice and includes several important QA audit protocols in PQP factory witnesses.

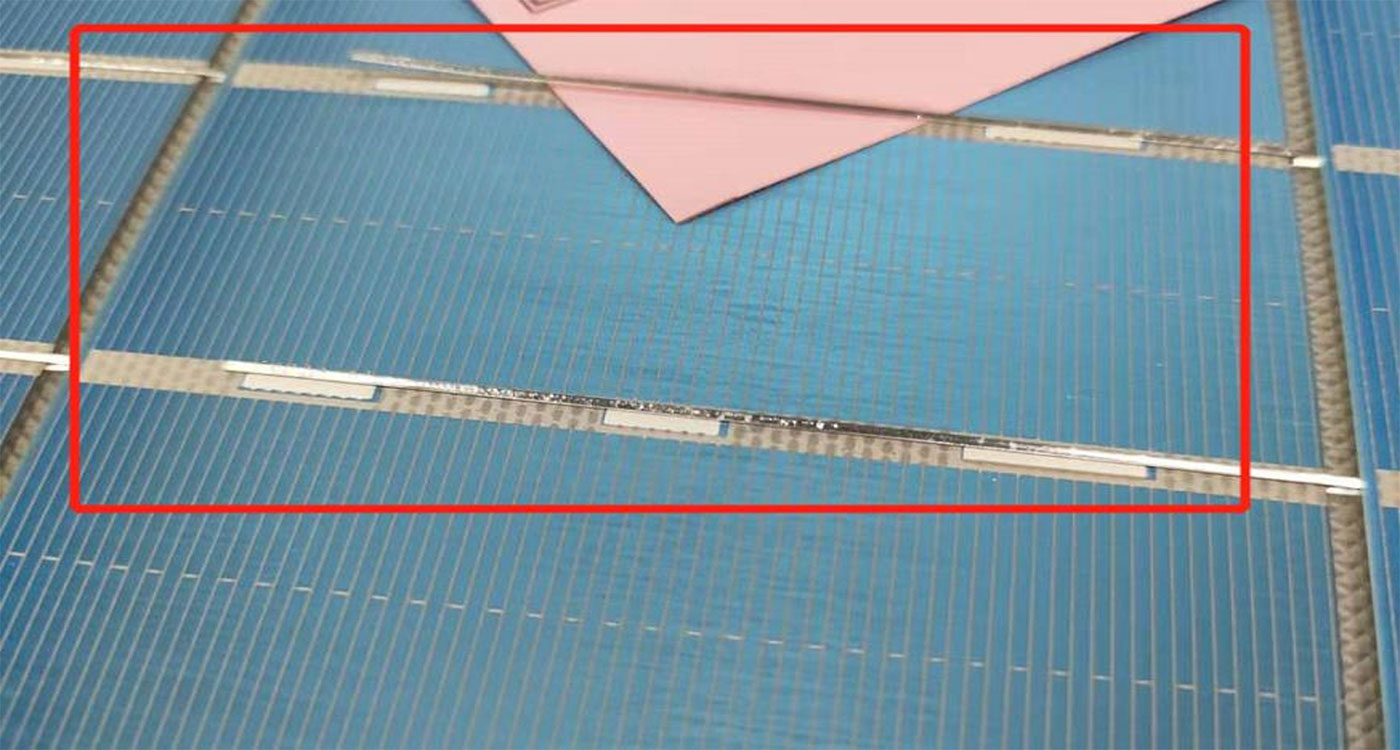
CEA Visual Paper Gap Test PV Cell Soldering
Poor soldering can be identified with a visual paper gap test. Photo courtesy of CEA.

Poor soldering can be mitigated by regularly ensuring that tabbing/stringing machines are set to correct specifications and by performing quality checks such as visual inspection, EL imaging and gap tests.

Contributed by Morgan Oats, Marketing Manager, Clean Energy Associates

Source Details

CEA’s quality control engineers regularly encounter issues such as:

  • Cell ribbon misalignment
  • Poor/cold soldering
  • Poor pottant curing
  • Inaccurate electrical test results
  • Overlooked defects in EL images

Poor/cold soldering is one of the most commonly observed problems. It can lead to hotspots, low module power or even module failure in the field. Poor soldering occurs on automated lines if the tabbing/stringing machine operates outside of the set specifications or the wrong settings were input. On manual production lines, the cause is operator error.

The 2021 PV Module Reliability Scorecard shows Top Performers for six PQP test categories.

Not all products or model types are represented in every test. Manufacturers with top results can choose not to be listed in the Scorecard. In some cases, test results were not available at the time of publication.

Each set of results shows Top Performers listed in alphabetical order by manufacturer. An example of a module with high levels of degradation is provided for each reliability test, complete with electroluminescence (EL) images and flash test results. Results also show a chart of average power degradation for each module model that includes current and historical data.

Top Performers are determined by averaging results of every BOM tested by PVEL that is sold under the same model type. While individual BOMs are not marketed to buyers, PQP reports make it possible to procure BOMs that performed well in testing.

To be eligible for the Scorecard, manufacturers must have:

  • Completed the factory witness within 18 months of 2021
  • Submitted BOMs to all test sequences in the PQP1
  • Submitted at least two factory-witnessed PV module samples per test sequence.


1 Only characterizations for PAN files and IAM profiles are optional.

Top Performers must have less than 2% degradation following each reliability test sequence. PAN performance is determined using PVsyst simulations: Top Performers must finish in the top quartile of energy yield.

Industry Perspective: Models, BOMs, and the PV Module Supply Chain

STS completed GWs of PV module inspections in Q1 2021 and found that nearly a third of the projects exhibited at least one BOM-related non-conformity.

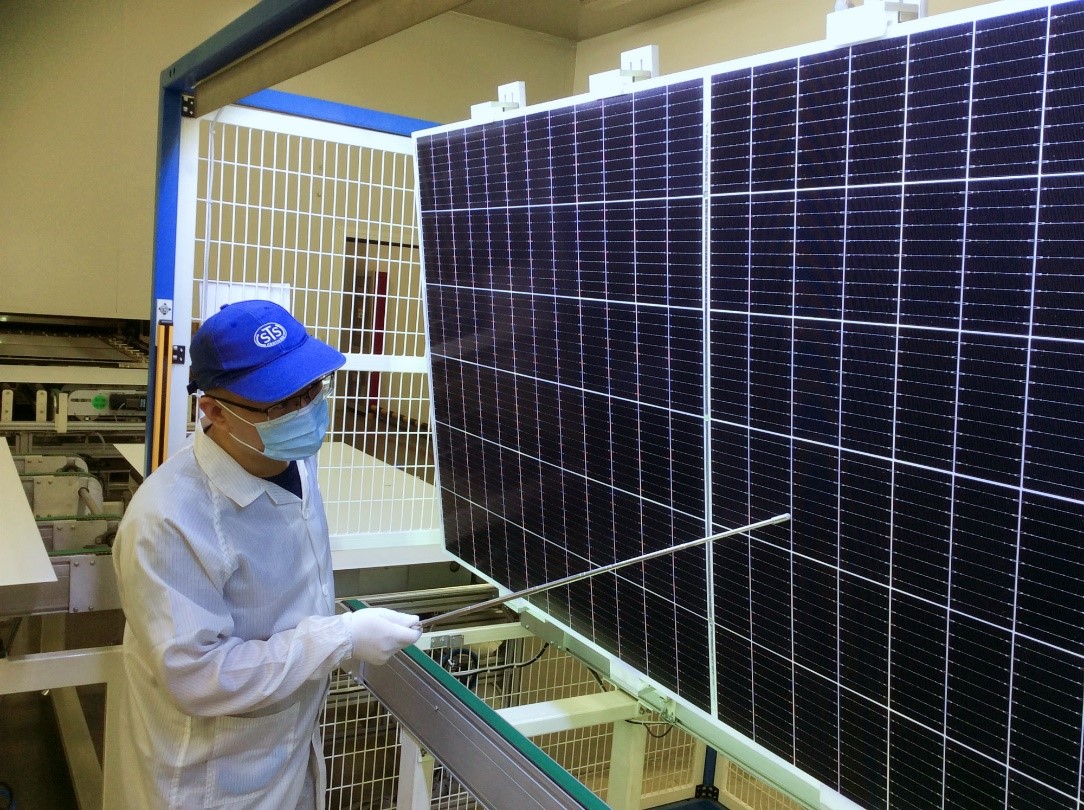
STS PV Module Inspection
STS inspector examines a module during a production audit. Photo courtesy of STS.

Contributed by Frederic Dross, Vice President, Strategic Development, STS

Source Details

PV modules sold under the exact same model type can have completely different BOMs. As long as all materials are listed in the model’s IEC certification report, manufacturers can mix and match key components, including cells and backsheets. As an ISO/IEC 17020:2012-accredited inspection body specialized in photovoltaics and energy storage, Senergy Technical Services (STS) inspectors have witnessed these BOM variations in factories all over the world, for more than 10 years.

While the practice of supplying one BOM for certification testing and another BOM to the market raises quality concerns, supply chain diversification is necessary for a dependable global supply of PV modules. Through the past year, market turmoil caused by wide-ranging factors including COVID-related factory closures, new trade policies, new environmental or social responsibility requirements, and even shortages of glass or polysilicon, have highlighted the fragility of the PV module supply chain.

Learn something new?

Share it with your network.